


Article Figures & Tables
Figures
- Figure 1:
Transmission model structure. The boxes represent the health states of students. The arrows represent transitions between health states. Exposed cases can be either isolated or not; isolated cases (right side) represent students who were identified via contact tracing or randomized testing.
- Figure 2:
Box plots of the number of students who were infected over a 12.7-week term for different timetabling scenarios (no. of replications = 250). The tutorial or laboratory timetables are represented by no. of sections × size of sections. For example, 2 × 90 weekly represents the timetabling scenario of 2 tutorial or laboratory sections of 90 students each week. We used a population of 180 students for all scenarios. The coloured box represents median and interquartile range (IQR); whiskers the most extreme values within 1.5 times of the IQR beyond the 25th and 75th percentiles; and dots outliers.
- Figure 3:
Number of students who were infected and number of students isolated for the 6 × 30 biweekly timetable with contact tracing and testing (means with 95% confidence intervals). Simulations were performed at testing frequencies ranging from 3 students tested per day to 36 students tested per day. From an individual student perspective, this corresponds to 1 test per student per 12-week term to 1 test per student per week, respectively. We also performed a base case of 0 students tested per day.
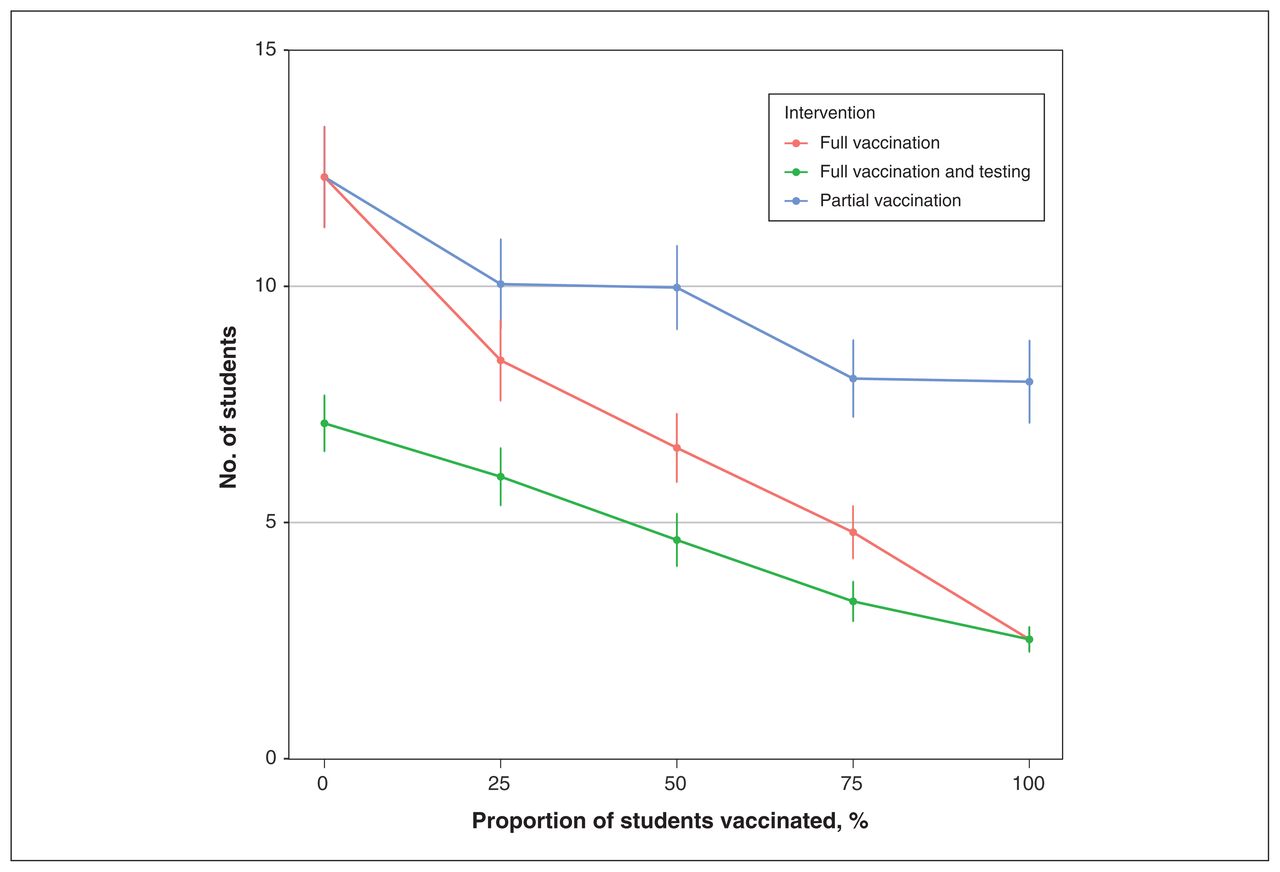
- Figure 4:
Number of students who were infected in the 6 × 30 biweekly timetable with vaccination scenario (partial = 1 dose, full = 2 doses) and weekly testing of nonvaccinated students (means with 95% confidence intervals). The effectiveness was based on a study of 2 SARS-CoV-2 vaccines, BNT162b2 (Pfizer-BioNTech) and ChAdOx1 nCoV-19 (AstraZeneca), against symptomatic disease caused by the B.1.617.2 (Delta) variant. (17)


Tables
Parameter Mean (95% CI) Model Source and notes Incubation period, d 5.08 (4.77–5.39) Sampled He et al.; (10) meta-analysis estimate of the mean incubation time Latent period, d 2.50 Fixed Tuite et al.; (11) retrospective cohort study estimate of the mean time to exposure to onset of infectiousness Time to isolation Symptom-based, d 4.60 (4.10–5.00) Sampled Bi et al.; (12) retrospective cohort study estimate of the mean time to isolation Contact-based, d 1.90 (1.10–2.70) Sampled Recovery time, d 20.80 (20.10–21.50) Sampled Bi et al.; (12) retrospective cohort study estimate of the mean recovery time Asymptomatic infection rate, % 46.00 (18.40–73.60) Sampled He et al.; (10) Meta-analysis estimate of the mean asymptomatic infection rate (10) Attack rate, % 6.10 (3.00–12.10) Sampled Koh et al.; (13) retrospective cohort study estimate of the mean attack rate. We used the estimate for 20–29 years of age. Secondary attack rate, % 4.00 (2.80–5.20) Fixed Koh et al.; (13) meta-analysis estimate of the mean secondary attack rate (SAR). We used the nonhousehold SAR and the ratio of symptomatic versus asymptomatic SAR to calculate the probability of virus spread for symptomatic and nonsymptomatic contacts, respectively. Outside transmission, cases/100 000/wk 153 Fixed We performed the calculation of the probability of outside transmission on a daily basis based on the incident rate reported by the Government of Alberta; (14) population statistics were taken from Statistics Canada. (15) Test duration, d 2 Fixed Government of Alberta; (14) less than 2 days from swab collection to test result (1 d for the laboratory to receive the swab and 13 h for the result) Isolation period, d 14 Fixed Government of Alberta (16) mandatory isolation guideline Vaccine effectiveness (1 dose), % 30.70 (25.20–35.70) Fixed (mean) Lopez Bernal et al. (17) Effectiveness of BNT162b2 (Pfizer-BioNTech) and ChAdOx1 nCoV-19 (AstraZeneca) vaccination against symptomatic disease caused by the B.1.617.2 (delta) variant. Vaccine effectiveness (2 doses), % 79.60 (76.70–82.10) Fixed (mean) Lopez Bernal et al. (17) Effectiveness of BNT162b2 (Pfizer-BioNTech) and ChAdOx1 nCoV-19 (AstraZeneca) vaccination against symptomatic disease caused by the B.1.617.2 (Delta) variant. Initial seeding 1 student Fixed We assumed an initial outbreak of 1 student who acquired SARS-CoV-2 infection. Note: CI = confidence interval. The “model” column indicates whether a sampled or a fixed value was used in the model. We took all samples from the Gaussian distribution. Descriptions of the distribution parameters are provided in Appendix 1A, available at www.cmajopen.ca/content/9/4/E1252/suppl/DC1.
- Table 2:
Number of students infected, using alternative surveillance policies with online lectures in the model
Timetable Surveillance type Mean ± SD 95% CI Weekly tutorial or laboratory section 1 × 180 Symptom 143.97 ± 38.01 139.23–148.46 2 × 90 Symptom 101.68 ± 38.38 96.90–106.46 3 × 60 Symptom 88.40 ± 34.73 84.07–92.72 1 × 180 Contact 18.41 ± 11.17 17.02–19.80 2 × 90 Contact 16.81 ± 10.21 15.54–18.08 3 × 60 Contact 17.70 ± 10.54 16.39–19.02 Biweekly tutorial or laboratory section 2 × 90 Symptom 23.62 ± 13.34 21.96–25.29 4 × 45 Symptom 22.78 ± 13.36 21.12–24.45 6 × 30 Symptom 22.50 ± 12.52 20.83–24.16 2 × 90 Contact 11.96 ± 6.76 11.11–12.80 4 × 45 Contact 11.70 ± 6.53 10.89–12.52 6 × 30 Contact 12.12 ± 6.20 11.34–12.89 Note: CI = confidence interval, SD = standard deviation. Tutorial or laboratory timetables are represented by no. of sections × size of sections. For example, 2 × 90 weekly represents the timetabling scenario with 2 tutorial or laboratory sections of 90 students each week.
In this issue

Article tools


Related Articles
Cited By...
- No citing articles found.