
Main menu

  • Home
  • Content
    • Current issue
    • Past issues
    • Collections
  • About
    • General information
    • Staff
    • Editorial board
    • Open access
    • Contact
  • CMAJ JOURNALS
    • CMAJ
    • CJS
    • JAMC
    • JPN

User menu

Search

  • Advanced search
CMAJ Open
  • CMAJ JOURNALS
    • CMAJ
    • CJS
    • JAMC
    • JPN
CMAJ Open

Advanced Search

  • Home
  • Content
    • Current issue
    • Past issues
    • Collections
  • About
    • General information
    • Staff
    • Editorial board
    • Open access
    • Contact
  • RSS feeds
Research
Open Access

Risk stratification for COVID-19 hospitalization: a multivariable model based on gradient-boosting decision trees

Jahir M. Gutierrez, Maksims Volkovs, Tomi Poutanen, Tristan Watson and Laura C. Rosella
December 21, 2021 9 (4) E1223-E1231; DOI: https://doi.org/10.9778/cmajo.20210036
Jahir M. Gutierrez
Layer 6 AI (Gutierrez, Volkovs, Poutanen); ICES (Volkovs, Watson, Rosella); Dalla Lana School of Public Health (Watson, Rosella), University of Toronto; Vector Institute (Rosella), Toronto, Ont.
PhD
  • Find this author on Google Scholar
  • Find this author on PubMed
  • Search for this author on this site
Maksims Volkovs
Layer 6 AI (Gutierrez, Volkovs, Poutanen); ICES (Volkovs, Watson, Rosella); Dalla Lana School of Public Health (Watson, Rosella), University of Toronto; Vector Institute (Rosella), Toronto, Ont.
PhD
  • Find this author on Google Scholar
  • Find this author on PubMed
  • Search for this author on this site
Tomi Poutanen
Layer 6 AI (Gutierrez, Volkovs, Poutanen); ICES (Volkovs, Watson, Rosella); Dalla Lana School of Public Health (Watson, Rosella), University of Toronto; Vector Institute (Rosella), Toronto, Ont.
MSc
  • Find this author on Google Scholar
  • Find this author on PubMed
  • Search for this author on this site
Tristan Watson
Layer 6 AI (Gutierrez, Volkovs, Poutanen); ICES (Volkovs, Watson, Rosella); Dalla Lana School of Public Health (Watson, Rosella), University of Toronto; Vector Institute (Rosella), Toronto, Ont.
MPH
  • Find this author on Google Scholar
  • Find this author on PubMed
  • Search for this author on this site
Laura C. Rosella
Layer 6 AI (Gutierrez, Volkovs, Poutanen); ICES (Volkovs, Watson, Rosella); Dalla Lana School of Public Health (Watson, Rosella), University of Toronto; Vector Institute (Rosella), Toronto, Ont.
PhD
  • Find this author on Google Scholar
  • Find this author on PubMed
  • Search for this author on this site
  • Article
  • Figures & Tables
  • Related Content
  • Responses
  • Metrics
  • PDF
Loading

Article Figures & Tables

Figures

  • Tables
  • Figure 1:
    • Download figure
    • Open in new tab
    • Download powerpoint
    Figure 1:

    Electronic medical records used for model development. The date of diagnosis of SARS-CoV-2 infection is used as the index date. From this date, a look-ahead period of 30 days is used to look for the outcome of hospitalization related to COVID-19. Besides including demographic information, independent predictor variables were constructed by aggregating 2 years of medical records (e.g., past health care utilization, laboratory results and drug prescriptions) up to 30 days before the index date. The complete list of predictor variables calculated can be found in Appendix 1, Supplementary Table 1 (available at www.cmajopen.ca/content/9/4/E1223/suppl/DC1). The icons used in this figure are freely available at www.flaticon.com and were downloaded from this site on Jan. 17, 2021.
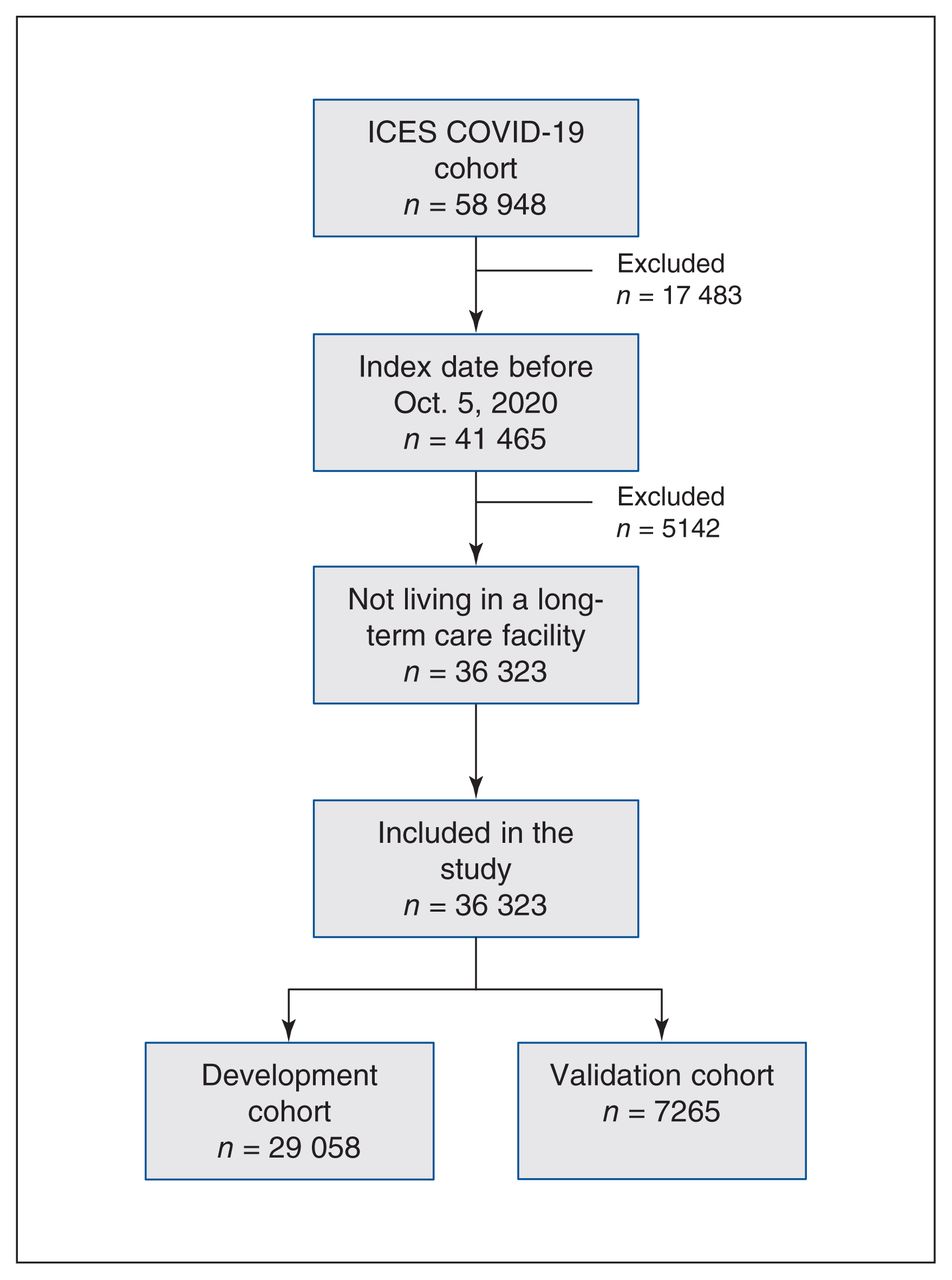
  • Figure 2:
    • Download figure
    • Open in new tab
    • Download powerpoint
    Figure 2:

    Flow diagram of study cohort (derivation and validation). The ICES COVID-19 cohort was last updated on Nov. 7, 2020, and it includes patients with index (diagnosis) dates between Feb. 2, 2020, and Nov. 5, 2020. Patients with an index date after Oct. 5, 2020, or currently living in a long-term care facility were excluded. Included patients were followed up for 30 days for the outcome of hospitalization for COVID-19.

  • Figure 3:
    • Download figure
    • Open in new tab
    • Download powerpoint
    Figure 3:

    Extreme Gradient Boosting (XGBoost) model performance. The final model was trained with 18 features extracted from the ICES COVID-19 data source. (A) The blue line shows the receiver operating characteristic curve. (B) Calibration curve of the final XGBoost model on the validation data set, where each blue dot (bins in the histogram) corresponds to a decile of predicted risk.

  • Figure 4:
    • Download figure
    • Open in new tab
    • Download powerpoint
    Figure 4:

    Comparison of recall at top percentiles. The final Extreme Gradient Boosting (XGBoost) model recall (percentage of true hospitalizations recovered in validation data set) was compared against 4 empirical rules.

Tables

  • Figures
    • View popup
    Table 1:

    Baseline characteristics of patients included in the study

    CharacteristicNo. (%) of patients*Standardized difference (hospitalized – not hospitalized)
    All patients
    n = 36 323
    Hospitalized
    n = 2583
    Not hospitalized
    n = 33 740
    Age, yr, median (IQR)45 (31–58)64 (54–77)43 (30–56)1.175
    No. of comorbidities, median (IQR)†1 (0–3)3 (2–6)1 (0–3)0.935
    Male17 428 (48.0)1453 (56.3)15 975 (47.3)0.179
    Female18 895 (52.0)1130 (43.7)17 765 (52.7)−0.179
    Asthma5460 (15.0)480 (18.6)4980 (14.8)0.103
    Cancer1453 (4.0)297 (11.5)1156 (3.4)0.311
    Chronic heart failure831 (2.3)275 (10.6)556 (1.6)0.381
    COPD1959 (5.4)457 (17.7)1502 (4.5)0.432
    Diabetes5273 (14.5)940 (36.4)4333 (12.8)0.568
    Hypertension8994 (24.8)1477 (57.2)7517 (22.3)0.763
    Hospitalized for COVID-192583 (7.1)2583 (100)0 (0)NA
    Died from COVID-19906 (2.5)543 (21.0)364 (1.1)0.67
    • Note: COPD = chronic obstructive pulmonary disease, IQR = interquartile range, NA = not applicable.

    • ↵* Unless otherwise stated.

    • ↵† The variable “no. of comorbidities” accounts for the following conditions (see Model development under Methods): acute myocardial infarction, arrhythmia, arthritis, asthma, cancer, chronic heart failure, colitis, COPD, coronary disease, diabetes, hypertension, osteoarthritis, osteoporosis and kidney disease.

    • View popup
    Table 2:

    Baseline characteristics of patients in the development and validation sets

    CharacteristicNo. (%) of patients*Standardized difference
    Development set
    n = 29 058
    Validation set
    n = 7265
    Age, yr, median (IQR)44 (31–58)45 (31–58)−0.015
    No. of comorbidities, median (IQR)†1 (0–3)1 (0–3)−0.009
    Male13 995 (48.2)3433 (47.3)0.018
    Female15 063 (51.8)3832 (52.7)0.003
    Asthma4376 (15.1)1084 (14.9)0.004
    Cancer1163 (4.0)290 (4.0)0.001
    Chronic heart failure668 (2.3)163 (2.2)0.004
    COPD1549 (5.3)410 (5.6)−0.014
    Diabetes4202 (14.5)1071 (14.7)−0.008
    Hypertension7181 (24.7)1813 (25.0)−0.006
    Hospitalized for COVID-192043 (7.0)540 (7.4)−0.016
    Died from COVID-19719 (2.5)187 (2.6)−0.006
    • Note: COPD = chronic obstructive pulmonary disease, IQR = interquartile range.

    • ↵* Unless otherwise stated.

    • ↵† The variable “no. of comorbidities” accounts for the following conditions (see Model development under Methods): acute myocardial infarction, arrhythmia, arthritis, asthma, cancer, chronic heart failure, colitis, COPD, coronary disease, diabetes, hypertension, osteoarthritis, osteoporosis and kidney disease.

    • View popup
    Table 3:

    Variables included in final XGBoost model ranked by SHAP values of importance

    Predictor variableSHAP value*
    Age0.7567
    Days since last creatinine blood test0.1320
    Geographical latitude0.1299
    Days since last basophils test0.1196
    Male0.1196
    No. of family doctor visits in the last 2 yr0.1165
    No. of comorbidities0.1072
    No. of unique drug subclasses taken in the last 2 yr0.0845
    Highest recorded level of creatinine in the last 2 yr0.0773
    No. of diagnostic radiology studies in the last 2 yr0.0381
    Average measurement of neutrophils in blood in the last 2 yr0.0289
    No. of doctor visits in the last 2 yr0.0237
    Median level of neutrophils in the last 2 yr0.0165
    Average level of leukocytes in the last 2 yr0.0144
    No. of creatinine tests in the last 2 yr0.0144
    Highest recorded level of hemoglobin in blood in the last 2 yr0.0021
    History of chronic kidney disease0.0021
    Days since last mean corpuscular hemoglobin test in the last 2 yr0.0010
    • Note: SHAP = Shapley Additive Explanation, XGBoost = Extreme Gradient Boosting.

    • ↵* SHAP values represent the weighted average of marginal contributions for each predictive variable included in the XGBoost model.

PreviousNext
Back to top

In this issue

CMAJ Open: 9 (4)
Vol. 9, Issue 4
1 Oct 2021
  • Table of Contents
  • Index by author

Article tools

Respond to this article
Print
Download PDF
Article Alerts
To sign up for email alerts or to access your current email alerts, enter your email address below:
Email Article

Thank you for your interest in spreading the word on CMAJ Open.

NOTE: We only request your email address so that the person you are recommending the page to knows that you wanted them to see it, and that it is not junk mail. We do not capture any email address.

Enter multiple addresses on separate lines or separate them with commas.
Risk stratification for COVID-19 hospitalization: a multivariable model based on gradient-boosting decision trees
(Your Name) has sent you a message from CMAJ Open
(Your Name) thought you would like to see the CMAJ Open web site.
CAPTCHA
This question is for testing whether or not you are a human visitor and to prevent automated spam submissions.
Citation Tools
Risk stratification for COVID-19 hospitalization: a multivariable model based on gradient-boosting decision trees
Jahir M. Gutierrez, Maksims Volkovs, Tomi Poutanen, Tristan Watson, Laura C. Rosella
Oct 2021, 9 (4) E1223-E1231; DOI: 10.9778/cmajo.20210036

Citation Manager Formats

  • BibTeX
  • Bookends
  • EasyBib
  • EndNote (tagged)
  • EndNote 8 (xml)
  • Medlars
  • Mendeley
  • Papers
  • RefWorks Tagged
  • Ref Manager
  • RIS
  • Zotero
Share
Risk stratification for COVID-19 hospitalization: a multivariable model based on gradient-boosting decision trees
Jahir M. Gutierrez, Maksims Volkovs, Tomi Poutanen, Tristan Watson, Laura C. Rosella
Oct 2021, 9 (4) E1223-E1231; DOI: 10.9778/cmajo.20210036
Twitter logo Facebook logo Mendeley logo
  • Tweet Widget
  • Facebook Like

Related Articles

  • PubMed
  • Google Scholar

Cited By...

  • No citing articles found.
  • Google Scholar

Similar Articles

Collections

  • Clinical
    • Infectious Diseases
      • COVID-19
    • Public Health
      • Other public health
  • Nonclinical
    • Epidemiology
      • Other epidemiology
    • Health Policy
      • Other health policy

Content

  • Current issue
  • Past issues
  • Collections

About

  • General Information
  • Staff
  • Editorial Board
  • Advisory Panel
  • Contact Us
  • Reprints
  • Copyright and Permissions
CMAJ Group

Copyright 2025, CMA Impact Inc. or its licensors. All rights reserved. ISSN 2291-0026

All editorial matter in CMAJ OPEN represents the opinions of the authors and not necessarily those of the Canadian Medical Association or its subsidiaries.

To receive any of these resources in an accessible format, please contact us at CMAJ Group, 500-1410 Blair Towers Place, Ottawa ON, K1J 9B9; p: 1-888-855-2555; e: [email protected].

CMA Civility, Accessibility, Privacy


Powered by HighWire