


Article Figures & Tables
Figures
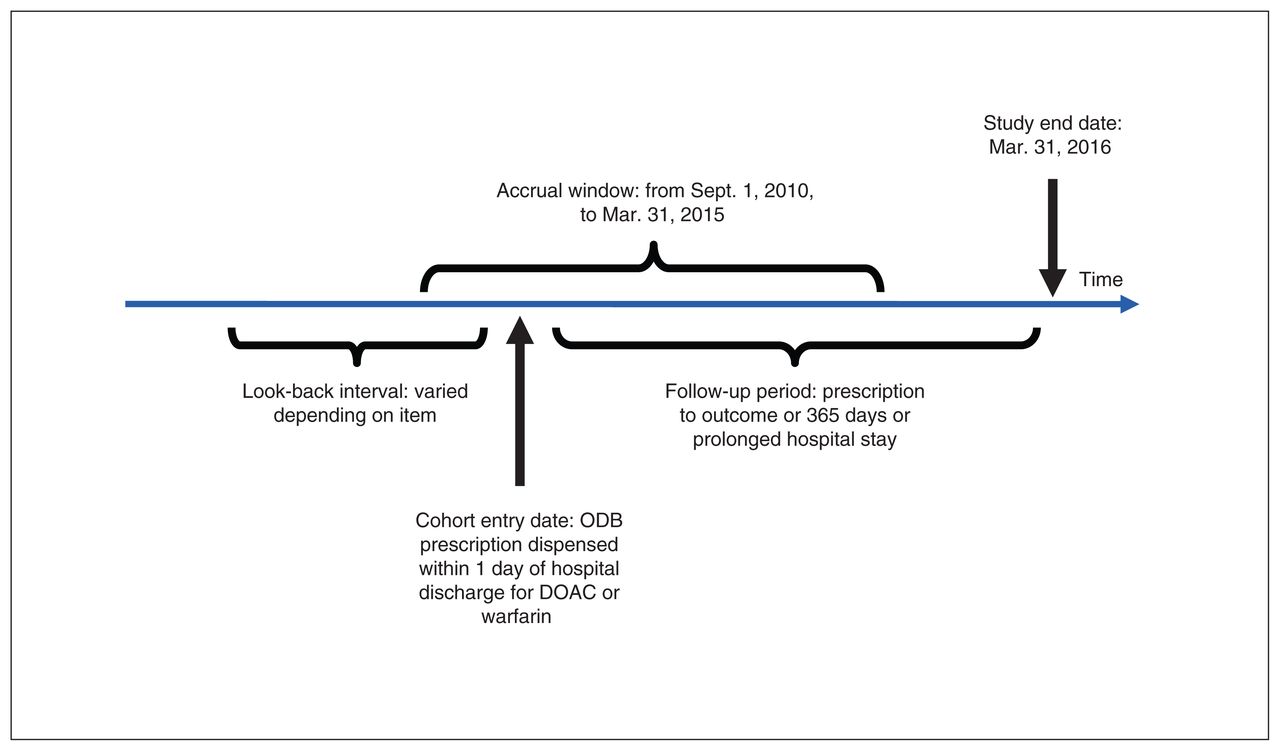
- Figure 1:
Cohort timelines and definitions. Note: ODB = Ontario Drug Benefit program, DOAC = direct-acting oral anticoagulant.
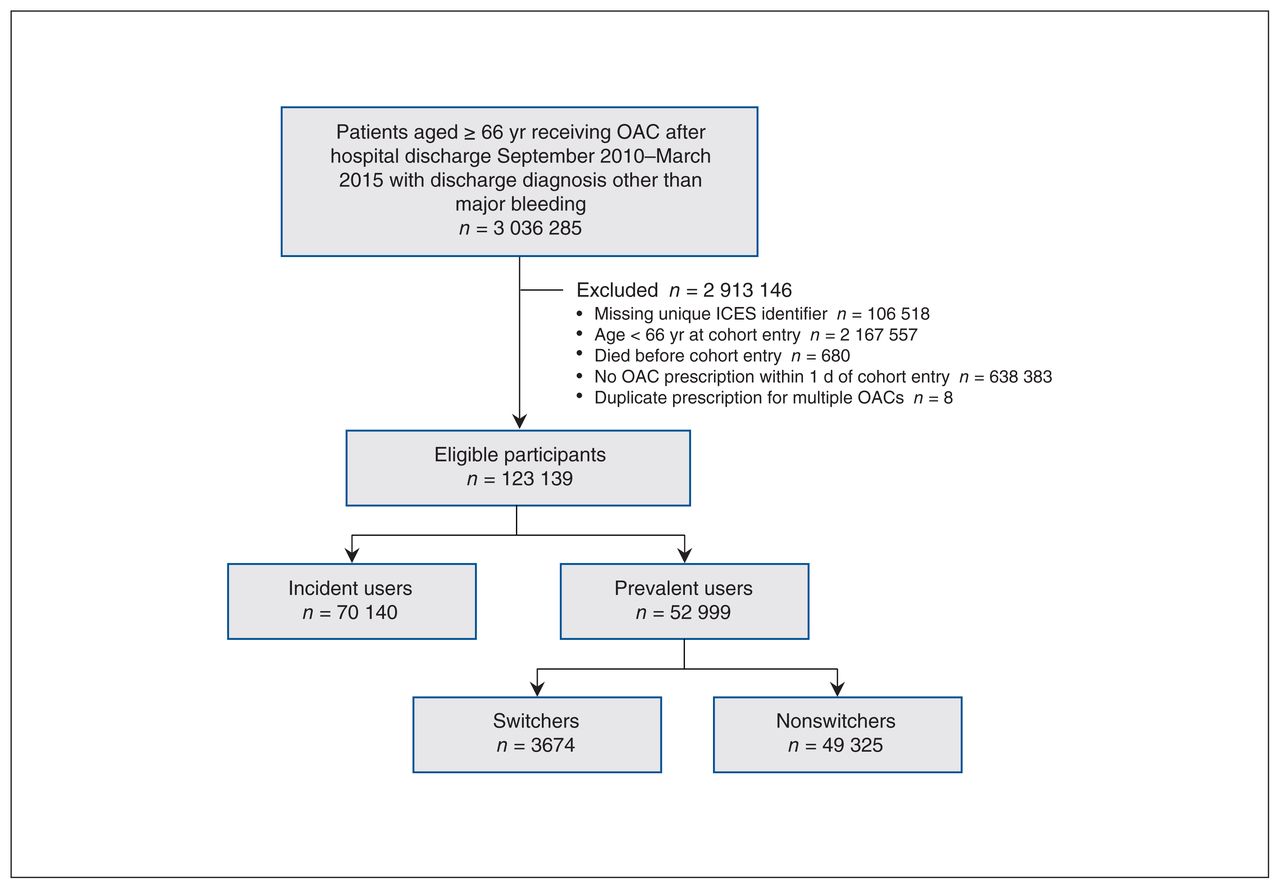
- Figure 2:
Flow diagram showing participant selection. Note: OAC = oral anticoagulant.
- Figure 3:
Postdischarge hemorrhage event rates.
- Figure 4:
Postdischarge thromboembolic event rates.


Tables
Name of database Content Canadian Institute for Health Information Discharge Abstract Database Patient-level demographic, diagnostic, procedural and treatment information on all acute care hospital admissions Canadian Institute for Health Information National Ambulatory Care Reporting System Patient-level demographic, diagnostic, procedural and treatment information on all emergency department visits The DrugList File List of Drug Identification Numbers used in Canada from 1990 forward; contains drug and product names, manufacturer, subclass information, pharmacy classification group codes, drug strength, route of administration, and first and last dispensing dates ICES-derived cohorts Validated cohorts of people with specific diseases and conditions, including the Ontario Congestive Heart Failure Database, Ontario Diabetes Database and Ontario Hypertension Data Set ICES Physician Database Characteristics of physicians and surgeons licensed to practise in Ontario Ontario Cancer Registry Patient-level demographic information and data on cancer diagnosis and cancer-related mortality Ontario Drug Benefit program database Records of dispensed outpatient prescriptions paid for by the provincial government Ontario Health Insurance Plan claims history database Claims for physician services paid for by the provincial government Ontario Health Insurance Plan Registered Persons Database Demographic information and data on place of residence and vital status for all people eligible to receive insured health care services in the province Statistics Canada Census Postal CodeOM Conversion File Information on rural residence and income quintiles of residents - Table 2:
Baseline characteristics of older adults in Ontario who started, continued or resumed oral anticoagulant therapy after hospital discharge between September 2010 and March 2015
Characteristic Entire cohort; no (%) of patients* Prevalent users; no (%) of patients* Overall
n = 123 139Incident users
n = 70 140Prevalent users
n = 52 999Standardized
differenceSwitchers
n = 3674Nonswitchers
n = 49 325Standardized difference Age, mean ± SD, yr 78.2 ± 7.7 76.1 ± 7.1 81.1 ± 7.6 0.69 79.4 ± 7.3 81.23 ± 7.6 0.24 Female sex 68 408 (55.6) 39 956 (57.0) 28 452 (53.7) 0.07 1846 (50.2) 26 606 (53.9) 0.07 Rural residence† 19 931 (16.2) 11 892 (17.0) 8039 (15.2) 0.05 580 (15.8) 7459 (15.1) 0.02 Anticoagulant dispensed Apixaban 5890 (4.8) 2810 (4.0) 3080 (5.8) 0.08 570 (15.5) 2510 (5.1) 0.35 Dabigatran 6608 (5.4) 2775 (4.0) 3833 (7.2) 0.14 473 (12.9) 3360 (6.8) 0.20 Rivaroxaban 51 409 (41.7) 42 546 (60.7) 8863 (16.7) 1.01 1150 (31.3) 7713 (15.6) 0.38 Warfarin 59 232 (48.1) 22 009 (31.4) 37 223 (70.2) 0.84 1481 (40.3) 35 742 (72.5) 0.69 Indication‡ Atrial fibrillation within 10 yr 62 957 (51.1) 22 530 (32.1) 40 427 (76.3) 0.99 2988 (81.3) 37 439 (75.9) 0.13 Joint replacement within 35 d 44 375 (36.0) 38 939 (55.5) 5436 (10.3) 1.10 502 (13.7) 4934 (10.0) 0.11 Major surgery during index hospital stay 22 043 (17.9) 17 384 (24.8) 4659 (8.8) 0.44 590 (16.1) 4069 (8.2) 0.24 Active cancer within 180 d 7858 (6.4) 3548 (5.1) 4310 (8.1) 0.12 278 (7.6) 4032 (8.2) 0.02 Deep vein thrombosis or pulmonary embolism during index hospital stay 6407 (5.2) 1783 (2.5) 4624 (8.7) 0.27 349 (9.5) 4275 (8.7) 0.03 Prescribing physician specialty† Family medicine 41 524 (33.7) 12 604 (18.0) 28 920 (54.6) 0.82 1274 (34.7) 27 646 (56.0) 0.44 Orthopedic surgery 31 394 (25.5) 28 014 (39.9) 3380 (6.4) 0.87 287 (7.8) 3093 (6.3) 0.06 Internal medicine 9958 (8.1) 5350 (7.6) 4608 (8.7) 0.04 432 (11.8) 4176 (8.5) 0.11 Cardiology 7083 (5.8) 3840 (5.5) 3243 (6.1) 0.03 441 (12.0) 2802 (5.7) 0.22 Hematology 2324 (1.9) 1808 (2.6) 516 (1.0) 0.12 107 (2.9) 409 (0.8) 0.15 Other 8792 (7.1) 4843 (6.9) 3949 (7.5) 0.02 387 (10.5) 3562 (7.2) 0.12 Unknown 22 064 (17.9) 13 681 (19.5) 8383 (15.8) 0.10 746 (20.3) 7637 (15.5) 0.13 Past medical history No. of hospital admissions within 1 yr, mean ± SD 0.67 ± 1.16 0.30 ± 0.73 1.16 ± 1.42 0.76 0.99 ± 1.32 1.17 ± 1.43 0.13 No. of thromboembolic events within 3 yr 13 741 (11.2) 10 483 (19.8) 3258 (4.6) 0.48 730 (19.9) 9753 (19.8) 0.00 Ischemic stroke 4419 (3.6) 990 (1.4) 3429 (6.5) 0.26 228 (6.2) 3201 (6.5) 0.01 Transient ischemic attack 2757 (2.2) 853 (1.2) 1904 (3.6) 0.16 142 (3.9) 1762 (3.6) 0.02 Peripheral vascular disease event 2540 (2.1) 680 (1.0) 1860 (3.5) 0.17 106 (2.9) 1754 (3.6) 0.04 Systemic embolism 705 (0.6) 155 (0.2) 550 (1.0) 0.10 34 (0.9) 516 (1.0) 0.01 Pulmonary embolism 2393 (1.9) 349 (0.5) 2044 (3.9) 0.23 152 (4.1) 1892 (3.8) 0.02 Deep vein thrombosis 3280 (2.7) 580 (0.8) 2700 (5.1) 0.25 204 (5.6) 2496 (5.1) 0.02 Hemorrhagic event within 3 yr 13 406 (10.9) 3627 (5.2) 9779 (18.5) 0.42 616 (16.8) 9163 (18.6) 0.05 Intracranial bleeding 777 (0.6) 230 (0.3) 547 (1.0) 0.09 27 (0.7) 520 (1.1) 0.03 Upper gastrointestinal bleeding 3830 (3.1) 1068 (1.5) 2762 (5.2) 0.21 182 (5.0) 2580 (5.2) 0.01 Lower gastrointestinal bleeding 1498 (1.2) 453 (0.6) 1045 (2.0) 0.12 85 (2.3) 960 (1.9) 0.03 Other major bleed 8750 (7.1) 2132 (3.0) 6618 (12.5) 0.36 392 (10.7) 6226 (12.6) 0.06 Comorbidities Congestive heart failure 47 133 (38.3) 14 265 (20.3) 32 868 (62.0) 0.93 2096 (57.0) 30 772 (62.4) 0.11 Hypertension 106 292 (86.3) 57 447 (81.9) 48 845 (92.2) 0.31 3378 (91.9) 45 467 (92.2) 0.01 Diabetes 46 522 (37.8) 22 569 (32.2) 23 953 (45.2) 0.27 1627 (44.3) 22 326 (45.3) 0.02 Renal dysfunction§ 11 216 (9.1) 2491 (3.6) 8725 (16.5) 0.44 418 (11.4) 8307 (16.8) 0.16 Liver dysfunction¶ 1349 (1.1) 343 (0.5) 1006 (1.9) 0.13 68 (1.9) 938 (1.9) 0.00 Drug use disorder 14 226 (11.6) 11 642 (16.6) 2584 (4.9) 0.39 202 (5.5) 2382 (4.8) 0.03 Alcohol use disorder in previous 3 yr 1401 (1.1) 517 (0.7) 884 (1.7) 0.09 64 (1.7) 820 (1.7) 0.01 Charlson Comorbidity Index score 0 20 946 (17.0) 11 714 (16.7) 9232 (17.4) 0.02 669 (18.2) 8563 (17.4) 0.02 1 14 766 (12.0) 6041 (8.6) 8725 (16.5) 0.24 637 (17.3) 8088 (16.4) 0.03 ≥ 2 32 563 (26.4) 8967 (12.8) 23 596 (44.5) 0.75 1355 (36.9) 22 241 (45.1) 0.17 NA (no hospital admission) 54 864 (44.6) 43 418 (61.9) 11 446 (21.6) 0.90 1013 (27.6) 10 433 (21.2) 0.15 CHA2DS2-VASc score Mean ± SD 4.08 ± 1.59 3.49 ± 1.37 4.86 ± 1.53 0.95 4.77 ± 1.47 4.87 ± 1.53 0.07 Median (IQR) 4 (3–5) 3 (3–4) 5 (4–6) 0.98 5 (4–6) 5 (4–6) 0.07 HAS-B_ED score Mean ± SD 2.20 ± 0.68 2.09 ± 0.63 2.36 ± 0.71 0.41 2.30 ± 0.69 2.37 ± 0.72 0.09 Median (IQR) 2 (2–3) 2 (2–2) 2 (2–3) 0.38 2 (2–3) 2 (2–3) 0.10 Concomitant medication within previous 120 d Nonsteroidal anti-inflammatory drug 19 273 (15.7) 15 344 (21.9) 3929 (7.4) 0.42 304 (8.3) 3625 (7.3) 0.03 Acetylsalicylic acid 2870 (2.3) 2212 (3.2) 658 (1.2) 0.13 41 (1.1) 617 (1.3) 0.01 Other antiplatelet 7026 (5.7) 4459 (6.4) 2567 (4.8) 0.07 207 (5.6) 2360 (4.8) 0.04 Amiodarone 4048 (3.3) 598 (0.9) 3450 (6.5) 0.30 242 (6.6) 3208 (6.5) 0.00 Selective serotonin reuptake inhibitor 14 864 (12.1) 6189 (8.8) 8675 (16.4) 0.23 428 (11.6) 8247 (16.7) 0.15 Antibiotic** 17 345 (14.1) 7384 (10.5) 9961 (18.8) 0.24 541 (14.7) 9420 (19.1) 0.12 Note: IQR = interquartile range, NA = not available, SD = standard deviation.
↵* Except where noted otherwise.
↵† Data missing for less than 0.07% of patients.
↵‡ Patients could have more than 1 indication.
↵§ Included International Statistical Classification of Diseases and Related Health Problems, 10th Revision (ICD-10) codes for dialysis, chronic renal disease, renal cancer and renal surgery.
↵¶ Included ICD-10 codes for cirrhosis, chronic liver disease, liver cancer, hepatitis and liver surgery.
↵** Within 30 days.
Outcome No. (%) of patients Time; event rate per 100 person-years (95% CI) 1 yr First 30 d 2–12 mo Hemorrhage 8767 (100.0) 17.7 (17.4–18.1) 25.8 (24.8–26.8) 15.7 (15.3–16.1) Intracranial bleed 664 (7.6) 1.3 (1.2–1.4) 1.2 (1.0–1.4) 1.4 (1.3–1.5) Upper gastrointestinal bleed 2392 (27.3) 4.8 (4.6–5.0) 7.5 (7.0–8.0) 4.2 (4.0–4.4) Lower gastrointestinal bleed 669 (7.6) 1.4 (1.3–1.5) 1.9 (1.6–2.2) 1.2 (1.1–1.3) Other major bleed 5042 (57.5) 10.2 (9.9–10.5) 15.3 (14.5–16.0) 8.9 (8.6–9.2) Thromboembolic event 4643 (100.0) 9.4 (9.1–9.7) 19.3 (18.4–20.2) 6.9 (6.6–7.1) Ischemic stroke 1001 (21.6) 2.0 (1.9–2.2) 2.8 (2.5–3.2) 1.8 (1.7–2.0) Transient ischemic attack 542 (11.7) 1.1 (1.0–1.2) 1.5 (1.2–1.7) 1.0 (0.9–1.1) Peripheral vascular disease 789 (17.0) 1.6 (1.5–1.7) 1.9 (1.6–2.1) 1.5 (1.4–1.7) Systemic embolism 153 (3.3) 0.3 (0.3–0.4) 0.6 (0.5–0.8) 0.2 (0.2–0.3) Pulmonary embolism 978 (21.1) 2.0 (1.9–2.1) 6.4 (5.9–6.9) 0.9 (0.8–1.0) Deep vein thrombosis 1180 (25.4) 2.4 (2.3–2.5) 6.2 (5.7–6.7) 1.4 (1.3–1.5) Note: CI = confidence interval.
- Table 4:
Rates of outcome events over time after hospital discharge among incident and prevalent users
Outcome Incident users Prevalent users No. (%) of patients Time; event rate per 100 person-years (95% CI) No. (%) of patients Time; event rate per 100 person-years (95% CI) 1 yr First 30 d 2–12 mo 1 yr First 30 d 2–12 mo Hemorrhage 3312 (37.8) 14.6 (14.1–15.1) 21.9 (20.7–23.1) 12.1 (11.6–12.7) 5455 (62.2) 20.4 (19.9–20.9) 31.1 (29.4–32.8) 18.4 (17.8–18.9) Thromboembolic event 2274 (49.0) 10.0 (9.6–10.4) 21.4 (20.2–22.6) 6.2 (5.8–6.7) 2369 (51.0) 8.9 (8.5–9.2) 16.5 (15.3–17.7) 7.4 (7.0–7.8) Note: CI = confidence interval.
- Table 5:
Rates of outcome events over time after hospital discharge among nonswitchers and switchers
Outcome Nonswitchers Switchers No. (%) of patients Time; event rate per 100 person-years (95% CI) No. (%) of patients Time; event rate per 100 person-years (95% CI) 1 yr First 30 d 2–12 mo 1 yr First 30 d 2–12 mo Hemorrhage 5044 (92.5) 20.5 (19.9–21.0) 31.2 (29.5–32.9) 18.4 (17.8–19.0) 411 (7.5) 19.6 (17.7–21.5) 29.5 (23.4–35.7) 18.0 (16.0–19.9) Thromboembolic event 2164 (91.3) 8.8 (8.4–9.2) 16.0 (14.7–17.2) 7.4 (7.0–7.8) 205 (8.7) 9.8 (8.5–11.1) 23.8 (18.3–29.4) 7.5 (6.2–8.7) Note: CI = confidence interval.
Outcome Men Women No. (%) of patients Time; event rate per 100 person-years (95% CI) No. (%) of patients Time; event rate per 100 person-years (95% CI) 1 yr First 30 d 2–12 mo 1 yr First 30 d 2–12 mo Hemorrhage 4677 (53.3) 21.4 (20.8–22.0) 32.1 (30.5–33.8) 18.7 (18.0–19.3) 4090 (46.7) 14.8 (14.4–15.3) 20.8 (19.6–22.0) 13.3 (12.9–13.8) Thromboembolic event 2193 (47.2) 10.0 (9.6–10.5) 21.4 (20.0–22.7) 7.1 (6.8–7.5) 2450 (52.8) 8.9 (8.5–9.2) 17.7 (16.6–18.8) 6.7 (6.3–7.0) Note: CI = confidence interval.
In this issue

Article tools


Related Articles
Cited By...
- No citing articles found.