


Article Figures & Tables
Figures
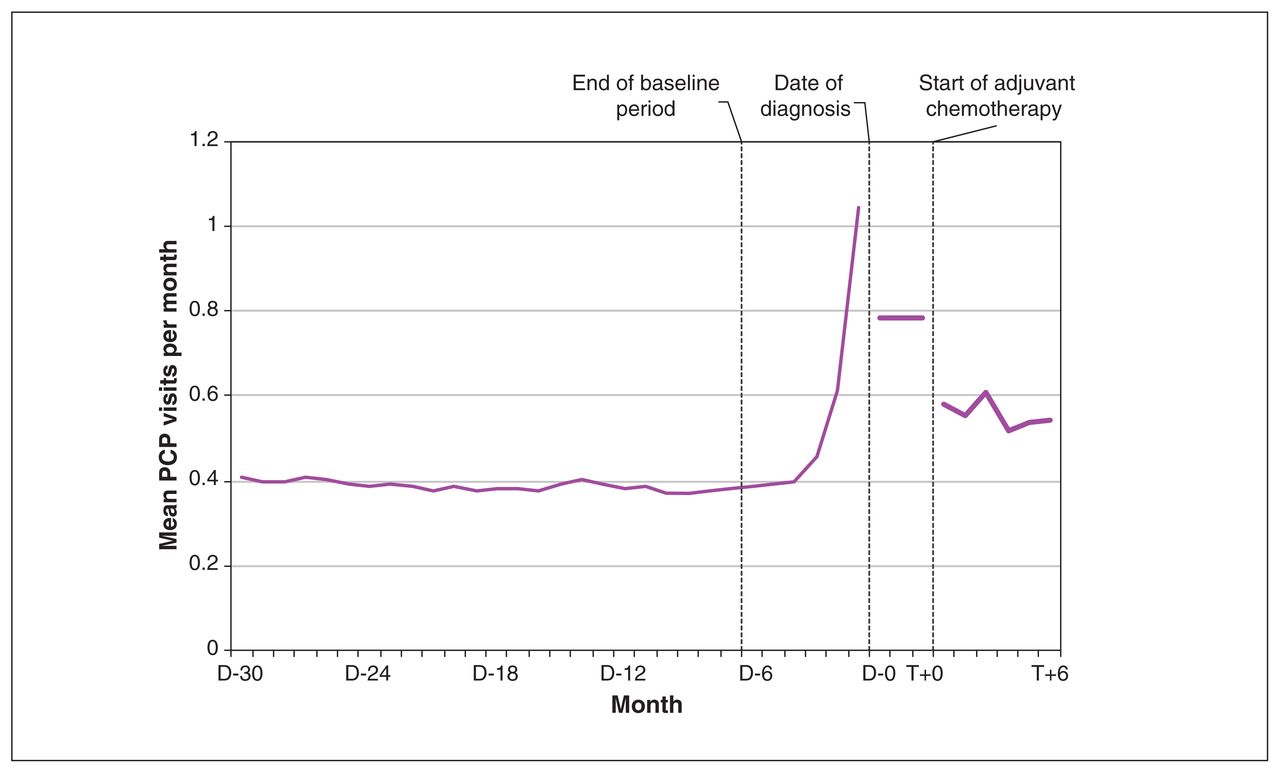
- Figure 1:
Mean primary care physician (PCP) visits per month before diagnosis and during adjuvant chemotherapy. D[n] is the number of months before diagnosis date and T[n] is the number of months from start of adjuvant chemotherapy. Note: Median number of days between date of diagnosis and start of adjuvant chemotherapy was 91 days.
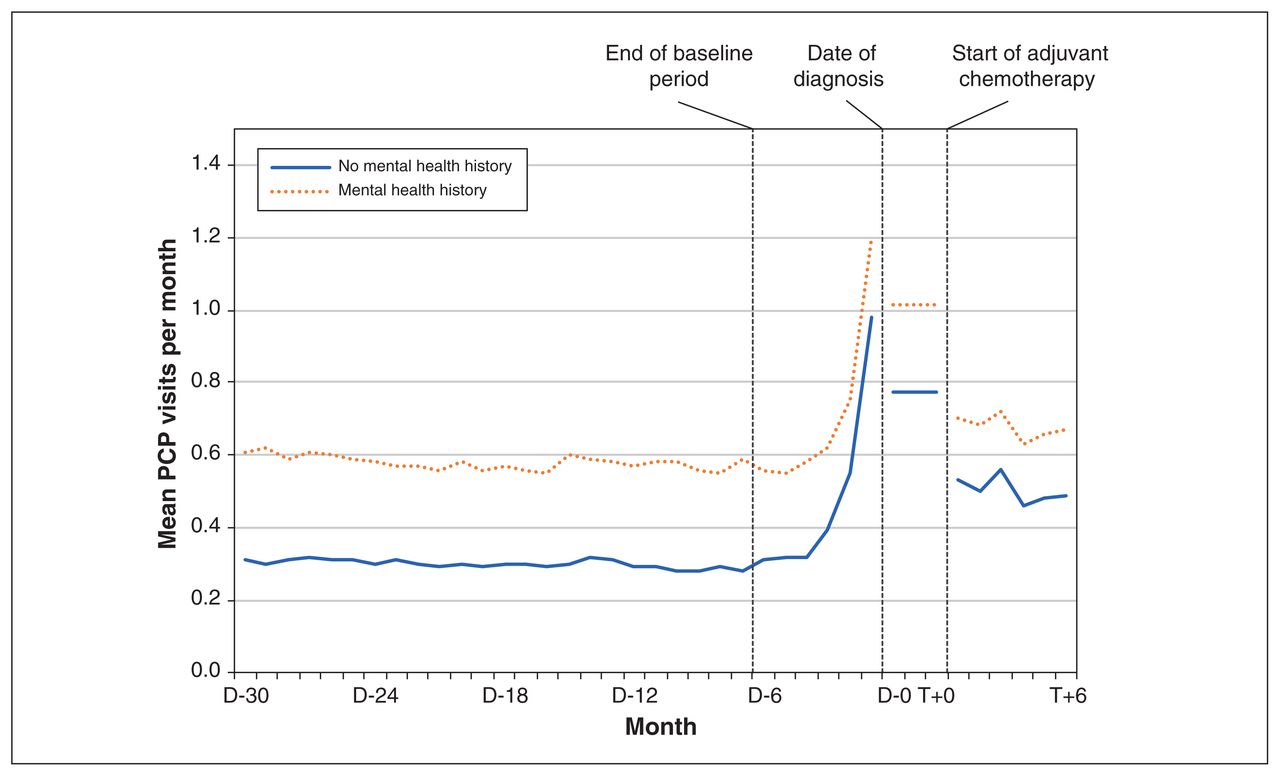
- Figure 2:
Mean primary care physician (PCP) visits per month before diagnosis and during adjuvant chemotherapy, by mental health history. D[n] is the number of months before diagnosis date and T[n] is the number of months from start of adjuvant chemotherapy. Note: Median number of days between date of diagnosis and start of adjuvant chemotherapy was 91 days.
- Figure 3:
Mean primary care physician (PCP) visits per month before diagnosis and during adjuvant chemotherapy, by physical comorbidity group. D[n] is the number of months before diagnosis date and T[n] is the number of months from start of adjuvant chemotherapy. Note: low comorbidity = 0–5 Aggregated Diagnosis Groups (ADGs), medium comorbidity = 6–9 ADGs, high comorbidity = 10+ ADGs. Median number of days between date of diagnosis and start of adjuvant chemotherapy was 91 days.
- Figure 4:
Relative increase in primary care physician visit rates from baseline to treatment periods (rate ratio), by mental health history and physical comorbidity groups and adjusted for age, immigration status, income, rurality, regional health district, continuity of primary care and primary care enrolment model. Note: low comorbidity = 0–5 Aggregated Diagnosis Groups (ADGs), medium comorbidity = 6–9 ADGs, high comorbidity = 10+ ADGs. 42 (0.3%) participants with missing values for at least 1 demographic characteristic were excluded from the multivariable modelling. Error bars represent 95% confidence intervals.


Tables
Characteristic Total, no. (%)
n = 12 781Physical comorbidity level, no. (%) p value Mental health history, no. (%) p value 0–5 ADGs (low)
n = 72876–9 ADGs (medium)
n = 4425≥ 10 ADGs (high)
n = 1069Yes
n = 4127No
n = 8654Age at diagnosis, yr < 40 1102 (8.6) 639 (8.8) 374 (8.5) 89 (8.3) < 0.001 349 (8.5) 753 (8.7) 0.008 40–49 3481 (27.2) 2177 (29.9) 1092 (24.7) 212 (19.8) 1134 (27.5) 2347 (27.1) 50–59 4225 (33.1) 2500 (34.3) 1417 (32.0) 308 (28.8) 1404 (34.0) 2821 (32.6) 60–69 3045 (23.8) 1581 (21.7) 1155 (26.1) 309 (28.9) 985 (23.9) 2060 (23.8) 70–74 607 (4.7) 262 (3.6) 239 (5.4) 106 (9.9) 180 (4.4) 427 (4.9) > 74 321 (2.5) 128 (1.8) 148 (3.3) 45 (4.2) 75 (1.8) 246 (2.8) Urban or rural residence Urban 11 189 (87.5) 6254 (85.8) 3957 (89.4) 978 (91.5) < 0.001 3677 (89.1) 7512 (86.8) 0.06 Rural 699 (5.5) 450 (6.2) 213 (4.8) 36 (3.4) 199 (4.8) 500 (5.8) Remote 596 (4.7) 392 (5.4) 168 (3.8) 36 (3.4) 170 (4.1) 426 (4.9) Very remote 292–297 (2.3) 187–192 (2.6) 85–90 (1.9–2.0) 15–20 (1.4–1.9) 80–85 (1.9–2.1) 210–215 (2.4–2.5) Unknown † † † † † † Immigration status* Nonimmigrants 11 075 (86.7) 6384 (87.6) 3775 (85.3) 916 (85.7) 0.001 3636 (88.1) 7439 (86.0) < 0.001 Immigrants 1706 (13.3) 903 (12.4) 650 (14.7) 153 (14.3) 491 (11.9) 1215 (14.0) Neighbourhood income quintile 0.073 0.09 1 (lowest) 2020 (15.8) 1121 (15.4) 705 (15.9) 194 (18.1) 685 (16.6) 1335 (15.4) 2 2384 (18.7) 1376 (18.9) 792 (17.9) 216 (20.2) 786 (19.0) 1598 (18.5) 3 2523 (19.7) 1433 (19.7) 879–883 (19.8–19.9) 207–211 (19.4–19.7) 839 (20.3) 1684 (19.5) 4 2819 (22.1) 1598 (21.9) 980 (22.1) 241 (22.5) 867 (21.0) 1952 (22.6) 5 (highest) 2994 (23.4) 1733 (23.8) 1051 (23.8) 210 (19.6) 934 (22.6) 2060 (23.8) Unknown 41 (0.3) 26 (0.4) 10–15 (0.2–0.3) † 16 (0.4) 25 (0.3) Baseline continuity of care 0 visit 800 (6.3) 788 (10.8) 7–12 (0.2–0.3) † < 0.001 18 (0.4) 782 (9.0) < 0.001 1–2 visits 1536 (12.0) 1472 (20.2) 59–64 (1.3–1.4) † 149 (3.6) 1387 (16.0) UPC ≤ 0.75 (low) 3914 (30.6) 1773 (24.3) 1661 (37.5) 480 (44.9) 1486 (36.0) 2428 (28.1) UPC > 0.75 (high) 6531 (51.1) 3254 (44.7) 2695 (60.9) 582 (54.4) 2474 (59.9) 4057 (46.9) Primary care practice model Straight FFS 1887 (14.8) 1193 (16.4) 568 (12.8) 126 (11.8) < 0.001 562 (13.6) 1325 (15.3) < 0.001 Enhanced FFS 6281 (49.1) 3212 (44.1) 2394 (54.1) 675 (63.1) 2213 (53.6) 4068 (47.0) Capitation 2235 (17.5) 1326 (18.2) 763 (17.2) 146 (13.7) 714 (17.3) 1521 (17.6) Team-based capitation 2206 (17.3) 1434 (19.7) 658 (14.9) 114 (10.7) 608 (14.7) 1598 (18.5) Other 172 (1.3) 122 (1.7) 42 (0.9) 8 (0.7) 30 (0.7) 142 (1.6) Regional health district (LHIN) < 0.001 < 0.001 Erie St. Clair 713 (5.6) 396 (5.4) 256 (5.8) 61 (5.7) 259 (6.3) 454 (5.2) South West 992 (7.8) 623 (8.5) 302 (6.8) 67 (6.3) 312 (7.6) 680 (7.9) Waterloo Wellington 654 (5.1) 436 (6.0) 188 (4.2) 30 (2.8) 180 (4.4) 474 (5.5) Hamilton Niagara Haldimand Brant 1468 (11.5) 906 (12.4) 471 (10.6) 91 (8.5) 454 (11.0) 1014 (11.7) Central West 543 (4.2) 248 (3.4) 226 (5.1) 69 (6.5) 180 (4.4) 363 (4.2) Mississauga Halton 750 (5.9) 393 (5.4) 273 (6.2) 84 (7.9) 226 (5.5) 524 (6.1) Toronto Central 1061 (8.3) 554 (7.6) 405 (9.2) 102 (9.5) 398 (9.6) 663 (7.7) Central 1784 (14.0) 886 (12.2) 712 (16.1) 186 (17.4) 550 (13.3) 1234 (14.3) Central East 1710 (13.4) 923 (12.7) 615 (13.9) 172 (16.1) 570 (13.8) 1140 (13.2) South East 520 (4.1) 349 (4.8) 137 (3.1) 34 (3.2) 139 (3.4) 381 (4.4) Champlain 1335 (10.4) 784 (10.8) 453 (10.2) 98 (9.2) 460 (11.1) 875 (10.1) North Simcoe Muskoka 518–522 (4.1) 325–329 (4.5) 170–174 (3.8–3.9) 14–18 (1.3–1.7) 177–181 (4.3–4.4) 338–342 (3.9–4.0) North East 478 (3.7) 301 (4.1) 146 (3.3) 31 (2.9) 157 (3.8) 321 (3.7) North West 252 (2.0) 157 (2.2) 69 (1.6) 26 (2.4) 62 (1.5) 190 (2.2) Unknown † † † † † † Mental health history 4127 (32.3) 1,730 (23.7) 1810 (40.9) 587 (54.9) < 0.001 Physical ADGs 0–5 7287 (57.01) 1730 (41.9) 5557 (64.2) < 0.001 6–9 4425 (34.6) 1810 (43.9) 2615 (30.2) ≥ 10 1069 (8.4) 587 (14.2) 482 (5.6) Note: ADGs = Aggregated Diagnosis Groups, FFS = fee for service, LHIN = local health integration network, UPC = usual provider of care index.
↵* Nonimmigrants includes Canadian-born citizens or immigrants arriving to Canada before 1985.
↵† Denotes too few cases to report. Ranges provided in associated rows or columns to prevent reidentification of small cells as per ICES policy.
- Table 2:
Mean PCP visits (per 6 mo) during baseline and treatment periods stratified by cohort characteristics
Characteristic Total, no. (%)
n = 12 781*Baseline PCP visits, mean ± SD† p value Treatment PCP visits, mean ± SD p value Difference (treatment – baseline), mean ± SD p value Total 2.3 ± 2.5 3.4 ± 3.4 1.0 ± 3.3 Age at diagnosis, yr < 0.0001 < 0.0001 0.3662 < 40 1102 (8.6) 2.2 ± 2.2 3.0 ± 3.7 0.9 ± 3.6 40–49 3481 (27.2) 2.1 ± 2.3 3.1 ± 3.1 1.0 ± 3.1 50–59 4225 (33.1) 2.3 ± 2.6 3.3 ± 3.1 1.0 ± 3.2 60–69 3045 (23.8) 2.5 ± 2.5 3.6 ± 3.4 1.0 ± 3.4 70–74 607 (4.7) 3.1 ± 2.6 4.2 ± 3.8 1.0 ± 3.3 > 74 321 (2.5) 3.0 ± 2.7 4.4 ± 4.9 1.3 ± 4.8 Urban or rural residence < 0.0001 < 0.0001 < 0.0001 Urban 11 189 (87.5) 2.4 ± 2.5 3.3 ± 3.3 0.9 ± 3.2 Rural 699 (5.5) 2.0 ± 2.2 3.5 ± 3.6 1.5 ± 3.7 Remote 596 (4.7) 1.7 ± 1.7 3.5 ± 3.8 1.8 ± 3.8 Very remote 292–297 (2.3) 1.7 ± 1.9 4.7 ± 4.2 2.9 ± 4.3 Unknown ≤ 5 § § § Unknown ≤ 5 § § § Immigration status‡ 0.0439 0.2578 0.0079 Nonimmigrants 11 075 (86.7) 2.3 ± 2.5 3.4 ± 3.4 1.0 ± 3.3 Immigrants 1706 (13.3) 2.5 ± 2.2 3.3 ± 3.1 0.8 ± 3.1 Neighbourhood income quintile 0.0028 < 0.0001 0.2246 1 (lowest) 2020 (15.8) 2.4 ± 2.3 3.5 ± 3.6 1.1 ± 3.5 2 2384 (18.7) 2.3 ± 2.4 3.5 ± 3.4 1.1 ± 3.3 3 2523 (19.7) 2.4 ± 2.5 3.5 ± 3.3 1.0 ± 3.2 4 2819 (22.1) 2.3 ± 2.4 3.4 ± 3.3 1.0 ± 3.3 5 (highest) 2994 (23.4) 2.2 ± 2.7 3.1 ± 3.3 0.9 ± 3.3 Unknown 41 (0.3) 2.2 ± 1.5 3.9 ± 3.5 1.7 ± 3.2 Breast cancer stage 0.7891 0.8486 0.5796 I 2839 (22.2) 2.3 ± 2.2 3.4 ± 3.2 1.1 ± 3.2 II 7311 (57.2) 2.4 ± 2.4 3.3 ± 3.3 1.0 ± 3.2 III 2631 (20.6) 2.3 ± 2.9 3.4 ± 3.7 1.0 ± 3.7 Baseline continuity of care < 0.0001 < 0.0001 < 0.0001 0 visit 800 (6.3) 0.0 ± 0.0 2.1 ± 2.7 2.1 ± 2.7 1–2 visits 1536 (12.0) 0.4 ± 0.1 2.1 ± 2.4 1.8 ± 2.4 UPC ≤ 0.75 (low) 3914 (30.6) 2.8 ± 2.5 3.6 ± 3.5 0.7 ± 3.6 UPC > 0.75 (high) 6531 (51.1) 2.8 ± 2.5 3.7 ± 3.4 0.9 ± 3.3 Primary care practice model < 0.0001 < 0.0001 < 0.0001 Straight FFS 1887 (14.8) 2.1 ± 2.7 3.2 ± 3.4 1.1 ± 3.4 Enhanced FFS 6281 (49.1) 2.7 ± 2.7 3.6 ± 3.4 0.9 ± 3.3 Capitation 2235 (17.5) 2.1 ± 2.1 3.0 ± 3.1 0.9 ± 3.1 Team-based capitation 2206 (17.3) 1.7 ± 1.9 3.2 ± 3.3 1.5 ± 3.4 Other 172 (1.3) 1.3 ± 1.6 2.4 ± 3.2 1.1 ± 3.0 Regional health district (LHIN) < 0.0001 < 0.0001 < 0.0001 Erie St. Clair 713 (5.6) 2.4 ± 2.5 3.4 ± 3.7 1.1 ± 3.5 South West 992 (7.8) 2.1 ± 2.0 3.8 ± 3.2 1.8 ± 3.2 Waterloo Wellington 654 (5.1) 1.7 ± 1.8 2.7 ± 3.0 1.0 ± 2.7 Hamilton Niagara 1468 (11.5) 2.1 ± 2.2 3.5 ± 3.1 1.4 ± 3.0 Haldimand Brant Central West 543 (4.2) 3.0 ± 2.4 3.5 ± 3.1 0.5 ± 3.1 Mississauga Halton 750 (5.9) 2.6 ± 2.4 2.8 ± 3.1 0.2 ± 3.0 Toronto Central 1061 (8.3) 2.5 ± 3.2 3.0 ± 3.3 0.5 ± 3.2 Central 1784 (14.0) 2.7 ± 2.7 3.2 ± 3.0 0.5 ± 3.3 Central East 1710 (13.4) 2.6 ± 2.4 3.4 ± 3.5 0.9 ± 3.4 South East 520 (4.1) 2.0 ± 2.1 3.1 ± 3.5 1.2 ± 3.5 Champlain 1335 (10.4) 2.1 ± 2.6 3.9 ± 3.3 1.8 ± 2.9 North Simcoe Muskoka 518–522 (4.1) 2.3 ± 2.9 3.0 ± 2.7 0.7 ± 3.5 North East 478 (3.7) 2.0 ± 1.9 3.1 ± 3.9 1.1 ± 3.6 North West 252 (2.0) 1.9 ± 1.8 4.4 ± 5.6 2.5 ± 5.6 Unknown ≤ 5 § § § Physical comorbidities < 0.0001 < 0.0001 < 0.0001 0–5 physical ADGs (low) 7287 (57.1) 1.4 ± 1.7 2.8 ± 3.0 1.4 ± 3.0 6–9 physical ADGs (medium) 4425 (34.6) 3.2 ± 2.3 3.8 ± 3.4 0.7 ± 3.4 ≥ 10 physical ADGs (high) 1069 (8.4) 5.6 ± 3.4 5.3 ± 4.2 –0.2 ± 4.0 Mental health history < 0.0001 < 0.0001 < 0.0001 Yes 4127 (32.3) 3.5 ± 3.1 4.1 ± 3.8 0.6 ± 3.7 No 8654 (67.7) 1.8 ± 1.9 3.0 ± 3.1 1.2 ± 3.1 Note: ADGs = Aggregated Diagnosis Groups, FFS = fee for service, LHIN = local health integration network, PCP = primary care practitioner, SD = standard deviation, UPC = usual provider of care index.
↵* Some participants (n = 72) died during the 6-month treatment period and others (n = 319) were not eligible for Ontario Health Insurance Plan during the full 24-month baseline period. We included an offset term in our multivariable model to account for differences in the exposure time of the baseline and treatment periods.
↵† Mean baseline PCP visits divided by 4 to obtain 6-month visit rate.
↵‡ Nonimmigrants includes Canadian-born citizens or immigrants arriving to Canada before 1985.
↵§ Denotes too few cases to report.
Rank Baseline period Treatment period Diagnostic code No. (%)
n = 119 294Diagnostic code No. (%)
n = 42 7481 Hypertension 10 951 (9.18) Breast cancer (female) 14 097 (32.98) 2 Anxiety 8533 (7.15) Anxiety 2686 (6.28) 3 Annual health examination 5606 (4.70) Hypertension 1757 (4.11) 4 URI 4844 (4.06) Other ill-defined conditions, general symptoms 1429 (3.34) 5 Diabetes 4696 (3.94) URI 1301 (3.04) Note: PCP = primary care physician, URI = upper respiratory infection.
In this issue

Article tools


