


Article Figures & Tables
Figures
- Figure 1:
Differentiated thyroid cancer age-standardized incidence rates (per 100 000 person-years) by sex and incidentally detected status, 1998–2017. Restricted to patients aged 15 to 84 years at diagnosis. Rates are age-standardized to people registered with an Ontario health card (Registered Persons Database). The shaded bands indicate the 95% confidence intervals for the rates. (A) Female age-standardized rates by incidentally detected status. (B) Male age-standardized rates by incidentally detected status.
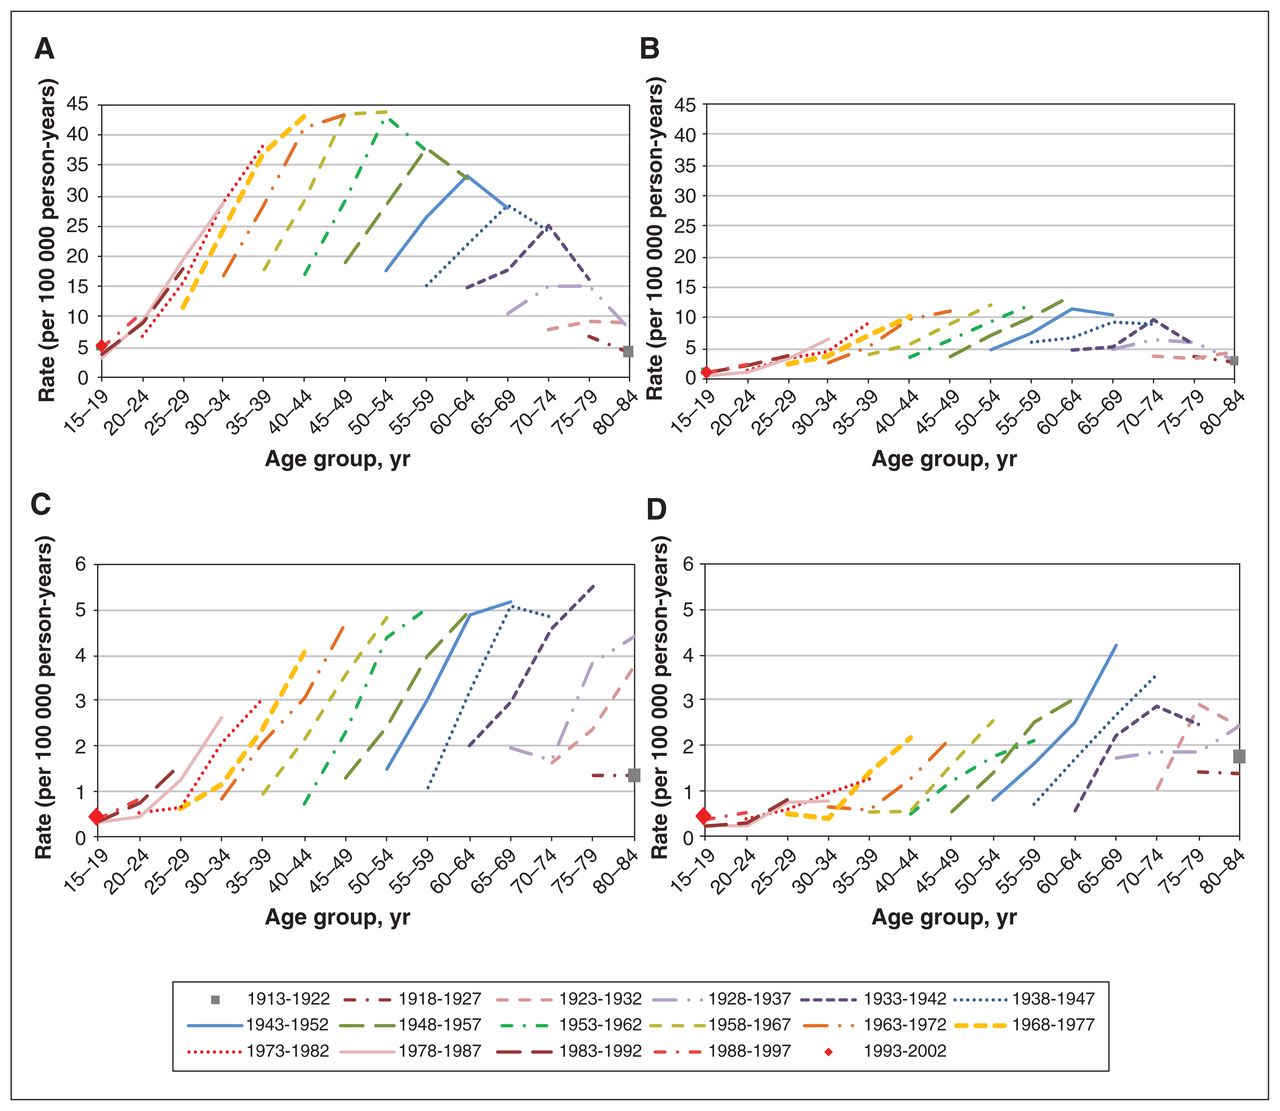
- Figure 2:
Differentiated thyroid cancer age-specific rates (per 100 000 person-years) by birth cohort and sex for nonincidentally detected cases (panels A and B) and incidentally detected cases (panels C and D). Restricted to patients aged 15 to 84 years at diagnosis. These descriptive results do not disentangle potential age, diagnosis period or birth cohort effects. (A) Female age-specific rates by birth cohort, nonincidentally detected cases. (B) Male age-specific rates by birth cohort, nonincidentally detected cases. (C) Female age-specific rates by birth cohort, incidentally detected cases. (D) Male age-specific rates by birth cohort, incidentally detected cases.
- Figure 3:
Differentiated thyroid cancer age-specific rates (per 100 000 person-years) by diagnosis period and sex for nonincidentally detected cases (panels A and B) and incidentally detected cases (panels C and D). Restricted to patients aged 15 to 84 years at diagnosis. These descriptive results do not disentangle potential age, diagnosis period or birth cohort effects. (A) Female age-specific rates by diagnosis period, nonincidentally detected cases. (B) Male age-specific rates by diagnosis period, nonincidentally detected cases. (C) Female age-specific rates by diagnosis period, incidentally detected cases. (D) Male age-specific rates by diagnosis period, incidentally detected cases.


Tables
- Table 1:
Characteristics of patients with differentiated thyroid cancer (n = 36 531) by sex and pathway to diagnosis (incidentally detected v. nonincidentally detected), Ontario, 1998–2017*†
Characteristic Female patients
n = 28 735; 78.7% of patientsMale patients
n = 7796; 21.3% of patientsIncidentally detected; no. (%)‡ Nonincidentally detected; no. (%)‡ Incidentally detected; no. (%)‡ Nonincidentally detected; no. (%)‡ Total 2680 (9.3) 26 055 (90.7) 1314 (16.9) 6482 (83.1) Age, yr 15–29 170 (6.3) 2596 (10.0) 67 (5.1) 540 (8.3) 30–49 954 (35.6) 12 563 (48.2) 406 (30.9) 2627 (40.5) 50–69 1166 (43.5) 9288 (35.6) 623 (47.4) 2755 (42.5) 70–84 390 (14.6) 1608 (6.1) 218 (16.6) 560 (8.6) Mean ± SD 52.7 ± 15.0 47.0 ± 13.7 54.7 ± 14.5 49.7 ± 14.0 Diagnosis period 1998–2002 247 (9.2) 3301 (12.6) 128 (9.7) 818 (12.6) 2003–2007 494 (18.4) 5599 (21.4) 232 (17.6) 1261 (19.4) 2008–2012 843 (31.4) 8271 (31.7) 405 (30.8) 1941 (29.9) 2013–2017 1096 (40.9) 8884 (34.1) 549 (41.7) 2462 (38.0) Birth cohort 1913–1922 7 (0.2) 26 (0.1) –** 12 (0.2) 1918–1927 24 (0.9) 98 (0.3) 16 (1.2) 38 (0.6) 1923–1932 74 (2.7) 255 (1.0) 44 (3.3) 90 (1.4) 1928–1937 120 (4.4) 516 (2.0) 71 (5.4) 191 (2.9) 1933–1942 181 (6.7) 899 (3.4) 83 (6.3) 282 (4.3) 1938–1947 215 (8.0) 1366 (5.2) 123 (9.3) 451 (6.9) 1943–1952 288 (10.7) 2086 (8.0) 173 (13.1) 655 (10.1) 1948–1957 284 (10.6) 2707 (10.4) 164 (12.4) 765 (11.8) 1953–1962 330 (12.3) 3358 (12.9) 146 (11.1) 833 (12.8) 1958–1967 327 (12.2) 3816 (14.6) 145 (11.0) 879 (13.5) 1963–1972 281 (10.5) 3379 (12.9) 112 (8.5) 751 (11.6) 1968–1977 202 (7.5) 2832 (10.8) 101 (7.6) 564 (8.7) 1973–1982 144 (5.3) 2104 (8.0) 59 (4.5) 422 (6.5) 1978–1987 108 (4.0) 1434 (5.5) 36 (2.7) 272 (4.2) 1983–1992 62 (2.3) 723 (2.7) 21 (1.6) 170 (2.6) 1988–1997 24 (0.9) 352 (1.3) 15 (1.1) 81 (1.2) 1993–2002 9 (0.3) 104 (0.4) –** 26 (0.4) Alive 2428 (90.6) 25 162 (96.5) 1094 (83.2) 6035 (93.1) Histologically confirmed 2598 (96.9) 25 325 (97.2) 1279 (97.3) 6321 (97.5) Thyroid biopsy ≤ 6 mo before diagnosis date§ 1609 (60.0) 16 813 (64.5) 765 (58.2) 4220 (65.1) Imaging modality¶ CT 1760 (65.6) NA 960 (73.0) NA Carotid ultrasonography 275 (10.2) NA 115 (8.7) NA MRI 290 (10.8) NA 95 (7.2) NA SPECT 355 (13.2) NA 140 (10.6) NA Note: CT = computed tomography, MRI = magnetic resonance imaging, NA = not applicable, SD = standard deviation, SPECT = single-photon emission computed tomography.
↵* Incidentally detected status using a 3-month look-back period from patient index date (see main text).
↵† For each sex, except for histologic confirmation, characteristics differed significantly by incidentally detected status (χ2 test for categorical variables; t test for continuous variables; p < 0.001). The proportion of histologically confirmed cases did not vary by incidentally detected status (p > 0.990 for females and males).
↵‡ Unless stated otherwise.
↵§ Includes thyroid gland core biopsy, fine-needle aspiration biopsy and aspiration procedures (Ontario Health Insurance Plan fee codes Z727, Z771 and Z726, respectively).
↵¶ Positron emission tomography not shown because of few cases and thus values were randomly rounded to multiples of 5 to obscure back-calculation of those cases. Therefore, the modality strata do not total the counts by age group because of the rounding. Subtracting the counts by imaging modality strata from those by age group does not provide the actual counts for positron emission tomography–associated incidentally detected cases.
↵** Value suppressed owing to small sample size.
- Table 2:
Sex-specific model coefficients for differentiated thyroid cancer rates by incidentally detected status, 1998–2017*
Covariate Female patients; rate ratio (95% CI)
n = 28 735Male patients; rate ratio (95% CI)
n = 7796Nonincidentally detected†
n = 26 055Incidentally detected
n = 2680Nonincidentally detected
n = 6482Incidentally detected
n = 1314Age group, yr 15–19 0.23 (0.04–1.22) 0.09 (0.06–0.14) 0.11 (0.09–0.14) 0.06 (0.03–0.12) 20–24 0.44 (0.10–1.83) 0.17 (0.13–0.23) 0.22 (0.19–0.26) 0.13 (0.08–0.21) 25–29 0.68 (0.21–2.25) 0.31 (0.25–0.39) 0.38 (0.34–0.44) 0.26 (0.19–0.37) 30–34 0.90 (0.35–2.33) 0.51 (0.42–0.61) 0.53 (0.47–0.59) 0.38 (0.28–0.52) 35–39 1.01 (0.49–2.07) 0.64 (0.54–0.76) 0.77 (0.70–0.86) 0.55 (0.43–0.71) 40–44 1.02 (0.63–1.65) 0.77 (0.65–0.90) 0.87 (0.79–0.96) 0.69 (0.54–0.87) 45–49 1.03 (0.80–1.31) 0.89 (0.76–1.03) 0.91 (0.82–1.00) 0.83 (0.66–1.04) 50–54 Referent Referent Referent Referent 55–59 0.87 (0.68–1.11) 1.01 (0.86–1.18) 1.06 (0.96–1.17) 1.06 (0.85–1.32) 60–64 0.75 (0.46–1.21) 1.13 (0.96–1.32) 1.12 (1.01–1.23) 1.23 (0.99–1.54) 65–69 0.62 (0.30–1.27) 1.14 (0.97–1.35) 0.90 (0.81–1.01) 1.61 (1.29–2.00) 70–74 0.54 (0.21–1.41) 0.97 (0.81–1.17) 0.86 (0.76–0.98) 1.45 (1.14–1.85) 75–79 0.36 (0.11–1.18) 1.00 (0.82–1.22) 0.56 (0.47–0.66) 1.23 (0.93–1.62) 80–84 0.19 (0.05–0.80) 0.82 (0.65–1.03) 0.37 (0.29–0.46) 1.04 (0.74–1.47) Diagnosis period 1998–2002 Referent Referent Referent Referent 2003–2007 1.60 (1.26–2.04) 1.80 (1.55–2.10) 1.39 (1.27–1.52) 1.62 (1.30–2.01) 2008–2012 2.35 (1.46–3.77) 2.88 (2.50–3.32) 2.03 (1.87–2.20) 2.62 (2.14–3.19) 2013–2017 2.49 (1.22–5.08) 3.45 (3.00–3.96) 2.38 (2.20–2.58) 3.21 (2.65–3.90) Note: CI = confidence interval.
↵* Estimates are for the 3-month look-back period; Appendix 3 (Supplementary Tables 1–4; available at www.cmajopen.ca/content/8/4/E695/suppl/DC1) provides estimates for each look-back period.
↵† Female nonincidentally detected statistical model includes birth cohort parameter estimates, which are nonsignificant owing to the constraint imposed (birth cohort parameter 1918–1927 = 1923–1932). Complete coefficients are provided in Appendix 3 (Supplementary Table 1).
- Table 3:
Sex-specific model coefficients for rates of incidentally detected differentiated thyroid cancer by imaging modality, 1998–2017*
Covariate Female patients; rate ratio (95% CI)
n = 2680†Male patients; rate ratio (95% CI)
n = 1314†Imaging modality CT Referent Referent Carotid ultrasonography 0.15 (0.10–0.23) 0.19 (0.12–0.32) MRI 0.08 (0.05–0.14) 0.02 (0.01–0.09) SPECT 0.16 (0.11–0.24) 0.15 (0.08–0.26) Age group, yr 15–19 0.09 (0.06–0.14) 0.06 (0.03–0.12) 20–24 0.17 (0.13–0.23) 0.13 (0.08–0.21) 25–29 0.31 (0.25–0.39) 0.26 (0.19–0.37) 30–34 0.50 (0.42–0.61) 0.38 (0.28–0.52) 35–39 0.64 (0.54–0.76) 0.55 (0.43–0.71) 40–44 0.77 (0.65–0.90) 0.69 (0.54–0.87) 45–49 0.89 (0.76–1.03) 0.83 (0.66–1.04) 50–54 Referent Referent 55–59 1.01 (0.86–1.18) 1.06 (0.85–1.32) 60–64 1.13 (0.96–1.32) 1.23 (0.99–1.54) 65–69 1.14 (0.97–1.35) 1.60 (1.28–1.99) 70–74 0.97 (0.81–1.17) 1.46 (1.14–1.85) 75–79 1.00 (0.82–1.22) 1.23 (0.93–1.62) 80–84 0.82 (0.65–1.03) 1.04 (0.74–1.47) Diagnosis period 1998–2002 Referent Referent 2003–2007 1.56 (1.30–1.88) 1.53 (1.18–1.97) 2008–2012 2.61 (2.20–3.09) 2.59 (2.05–3.26) 2013–2017 3.20 (2.71–3.77) 3.31 (2.64–4.14) Modality (period)‡ Carotid ultrasonography (2003–2007)§ 1.26 (0.77–2.07) 0.62 (0.31–1.23) Carotid ultrasonography (2008–2012)§ 1.07 (0.67–1.69) 0.53 (0.28–1.00) Carotid ultrasonography (2013–2017)§ 0.89 (0.56–1.40) 0.59 (0.33–1.06) MRI (2003–2007)§ 1.97 (1.07–3.60) 5.25 (1.19–23.15) MRI (2008–2012)§ 2.20 (1.25–3.88) 4.64 (1.09–19.80) MRI (2013–2017)§ 1.99 (1.14–3.49) 5.21 (1.24–21.84) SPECT (2003–2007)§ 1.61 (1.01–2.58) 1.42 (0.72–2.78) SPECT (2008–2012)§ 1.21 (0.77–1.90) 1.19 (0.63–2.24) SPECT (2013–2017)§ 1.24 (0.80–1.92) 0.65 (0.34–1.24) Note: CI = confidence interval, CT = computed tomography, MRI = magnetic resonance imaging, SPECT = single-photon emission computed tomography.
↵* Estimates are for the 3-month look-back period; Appendix 3 (Supplementary Tables 5–6; available at www.cmajopen.ca/content/8/4/E695/suppl/DC1) provides estimates for each look-back period.
↵† Total incidentally detected cases shown to obscure back-calculation of positron emission tomography–associated cases, which were excluded from imaging-specific models because of few cases.
↵‡ Denotes a statistical interaction term among the covariates.
↵§ Denotes the statistical interaction estimate among the covariate categories.
In this issue

Article tools


Related Articles
Cited By...
- No citing articles found.