


Article Figures & Tables
Figures
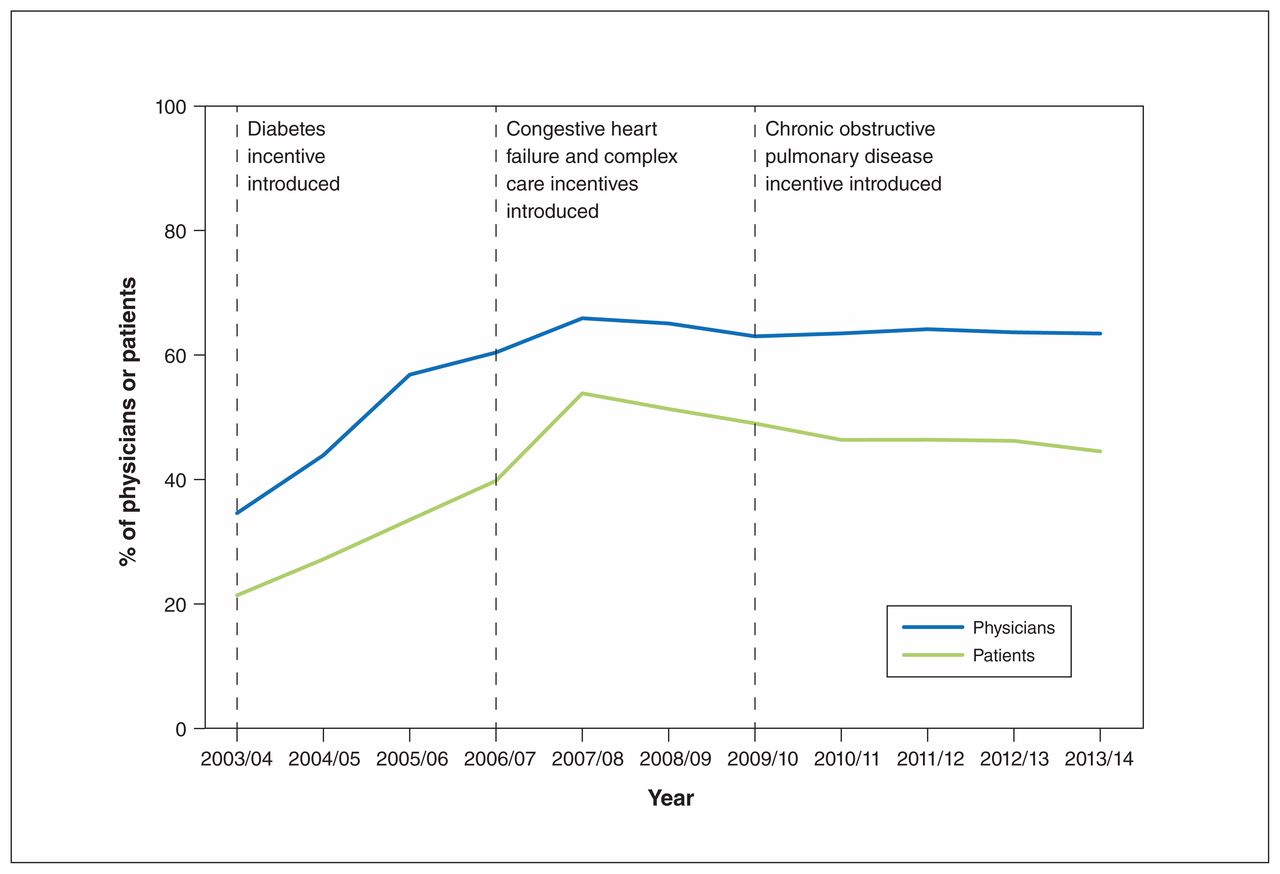
- Figure 1:
Proportion of primary care physicians who billed at least 1 chronic care or complex care incentive payment, and proportion of patients who had an incentive billed on their behalf, 2003/04 to 2013/14. Source: British Columbia Medical Services Plan (physician billing) information (15) and author calculations.
- Figure 2:
Flow diagram showing selection of patient cohort.
- Figure 3:
Flow diagram showing selection of physician cohort.


Tables
Incentive program Eligible patient conditions Annual incentive fee, $ Chronic Disease Management Diabetes, chronic obstructive pulmonary disease, heart failure 125* Complex Care Planning and Management ≥ 2 of the following conditions: diabetes, chronic renal failure, heart failure, chronic respiratory condition, cerebrovascular disease, ischemic heart disease, chronic neurodegenerative disease, chronic liver disease 315 Source: British Columbia Medical Services Commission payment schedule November 2010. (14)
↵* The chronic disease management program also included an incentive for hypertension valued at $50. We excluded this incentive because of its lower dollar value and lower complexity of needs of patients who are diagnosed only with hypertension.
- Table 2:
Characteristics of patients who had incentives billed on their behalf in all, some or none of the study years, 2010–2013
Characteristic No. (%) of patients* Standardized difference (no incentive billed v. billed in all 4 yr) Overall
n = 428 770No incentive billed in any year
n = 152 686Incentives billed in 1–3 yr
n = 133 609Incentives billed in all 4 yr
n = 142 475Sex Female 204 832 (47.8) 77 014 (50.4) 62 402 (46.7) 65 416 (45.9) 0.09 Male 223 811 (52.2) 75 644 (49.5) 71 169 (53.3) 76 998 (54.0) Missing 127 (< 0.1) 28 (< 0.1) 38 (< 0.1) 61 (< 0.1) Age group, yr ≤ 17 6815 (1.6) 6309 (4.1) 407 (0.3) 99 (0.1) 0.66 18–44 35 635 (8.3) 23 921 (15.7) 8090 (6.1) 3624 (2.5) 45–74 258 623 (60.3) 91 170 (59.7) 86 245 (64.6) 81 208 (57.0) ≥ 75 127 697 (29.8) 31 286 (20.5) 38 867 (29.1) 57 544 (40.4) Health authority Interior Health 75 525 (17.6) 24 566 (16.1) 22 679 (17.0) 28 280 (19.8) 0.17 Fraser Health 157 241 (36.7) 57 683 (37.8) 49 993 (37.4) 49 565 (34.8) Vancouver Coastal Health 96 180 (22.4) 38 239 (25.0) 28 595 (21.4) 29 346 (20.6) Vancouver Island Health Authority 76 642 (17.9) 24 275 (15.9) 24 055 (18.0) 28 312 (19.9) Northern Health 22 709 (5.3) 7722 (5.1) 8133 (6.1) 6854 (4.8) Missing 473 (0.1) 201 (0.1) 154 (0.1) 118 (0.1) Income quintile Q1 (lowest) 94 909 (22.1) 33 513 (21.9) 29 975 (22.4) 31 421 (22.0) 0.00 Q2 92 858 (21.7) 32 973 (21.6) 28 935 (21.7) 30 950 (21.7) Q3 85 283 (19.9) 30 213 (19.8) 26 298 (19.7) 28 772 (20.2) Q4 79 239 (18.5) 28 158 (18.4) 24 710 (18.5) 26 371 (18.5) Q5 (highest) 71 983 (16.8) 26 168 (17.1) 22 136 (16.6) 23 679 (16.6) Missing 4498 (1.0) 1661 (1.1) 1555 (1.2) 1282 (0.9) No. of incentive-eligible conditions first yr 1 248 472 (57.9) 113 697 (74.5) 78 964 (59.1) 55 811 (39.2) 0.78 2 139 278 (32.5) 34 036 (22.3) 43 197 (32.3) 62 045 (43.5) 3 36 868 (8.6) 4651 (3.0) 10 463 (7.8) 21 754 (15.3) 4 4152 (1.0) 302 (0.2) 985 (0.7) 2865 (2.0) Date of diagnosis of first eligible condition(s) 2010 45 768 (10.7) 18 937 (12.4) 16 703 (12.5) 10 128 (7.1) 0.29 1–4 yr prior (2006–2009) 165 924 (38.7) 66 063 (43.3) 51 125 (38.3) 48 736 (34.2) ≥ 5 yr prior (2005 or earlier) 217 078 (50.6) 67 686 (44.3) 65 781 (49.2) 83 611 (58.7) Non–fee-for-service encounter No 305 037 (71.1) 108 066 (70.8) 96 018 (71.9) 100 953 (70.9) −0.00 Yes 123 733 (28.9) 44 620 (29.2) 37 591 (28.1) 41 522 (29.1) No. of primary care physician visits over 4-yr study period 1–6 13 654 (3.2) 10 922 (7.2) 2595 (1.9) 137 (0.1) 0.73 7–12 26 185 (6.1) 16 692 (10.9) 7936 (5.9) 1557 (1.1) 13–24 90 973 (21.2) 38 604 (25.3) 31 702 (23.7) 20 667 (14.5) 25–48 168 835 (39.4) 51 541 (33.8) 53 039 (39.7) 64 255 (45.1) > 48 129 123 (30.1) 34 927 (22.9) 38 337 (28.7) 55 859 (39.2) No. of primary care physicians seen over 4-yr study period 1–2 63 259 (14.8) 25 431 (16.7) 18 064 (13.5) 19 764 (13.9) 0.08 3–4 96 166 (22.4) 34 188 (22.4) 29 117 (21.8) 32 861 (23.1) ≥ 5 269 345 (62.8) 93 067 (61.0) 86 428 (64.7) 89 850 (63.1) Usual provider continuity index, mean ± SD† 7.0 ± 2.1 6.6 ± 2.3 6.8 ± 2.1 7.6 ± 1.7 0.49 - Table 3:
Physician and practice characteristics for those who billed incentives in all, some or none of the study years, 2010–2013
Characteristic Overall
n= 3936Did not bill incentives in any year
n = 740Billed incentives in 1–3 yr
n = 571Billed incentives in all 4 yr
n = 2625Standardized difference (did not bill v. billed incentives in all 4 yr) Total billings (4-yr average), $, mean ± SD 228 846.3 ± 128 283.0 151 462.6 ± 123 551.6 156 760.6 ± 98 024.4 266 341.5 ± 118 601.0 0.95 No. of patients (4-yr average), mean ± SD 1854.4 ± 1056.4 1742.9 ± 1279.8 1849.9 ± 1119.2 1886.8 ± 967.3 0.13 % of eligible patients for whom incentives billed (4-yr), mean ± SD 21.3 ± 19.9 – 5.7 ± 7.4 30.7 ± 17.7 2.45 Sex, no. (%) Female 1417 (36.0) 246 (33.2) 263 (46.1) 908 (34.6) −0.03 Male 2519 (64.0) 494 (66.8) 308 (53.9) 1717 (65.4) Age group, yr, no. (%) < 35 158 (4.0) 25 (3.4) 49 (8.6) 84 (3.2) 0.16 35–44 766 (19.5) 155 (20.9) 153 (26.8) 458 (17.4) 45–54 1279 (32.5) 243 (32.8) 141 (24.7) 895 (34.1) 55–64 1168 (29.7) 192 (25.9) 123 (21.5) 853 (32.5) ≥ 65 565 (14.4) 125 (16.9) 105 (18.4) 335 (12.8) Health authority, no. (%) Interior Health 755 (19.2) 126 (17.0) 122 (21.4) 507 (19.3) 0.17 Fraser Health 1087 (27.6) 232 (31.4) 142 (24.9) 713 (27.2) Vancouver Coastal Health 1033 (26.2) 199 (26.9) 159 (27.8) 675 (25.7) Vancouver Island Health Authority 823 (20.9) 156 (21.1) 120 (21.0) 547 (20.8) Northern Health 212 (5.4) 21 (2.8) 23 (4.0) 168 (6.4) Missing 26 (0.7) 6 (0.8) 5 (0.9) 15 (0.6) Note: SD = standard deviation.
Variable Point estimate (95% CI) Patient level Sex Female (reference) Male 1.42 (1.39–1.45) Age group, yr ≤ 17 0.04 (0.03–0.05) 18–44 0.24 (0.23–0.26) 45–74 0.75 (0.73–0.76) ≥ 75 (reference) Health authority Vancouver Coastal Health (reference) Interior Health 1.44 (1.26–1.64) Fraser Health 1.15 (1.10–1.21) Vancouver Island Health Authority 1.35 (1.17–1.54) Northern Health 1.68 (1.36–2.06) Income quintile Q1 (lowest) 1.15 (1.11–1.19) Q2 1.12 (1.09–1.16) Q3 1.11 (1.07–1.15) Q4 1.05 (1.02–1.09) Q5 (highest) (reference) No. of eligible incentives (at start of study period) 1 0.33 (0.33–0.34) 2 (reference) 3 2.49 (2.38–2.61) 4 5.87 (5.00–6.89) Date of diagnosis of first eligible condition(s) 2010 (reference) 1–4 yr prior (2006–2009) 1.22 (1.18–1.27) ≥ 5 yr prior (2005 or earlier) 2.01 (1.94–2.08) Non–fee-for-service encounter Yes 0.89 (0.86–0.91) No (reference) No. of primary care physician contacts 1–6 (reference) 7–12 8.92 (7.39–10.77) 13–24 48.96 (40.86–58.68) 25–48 107.42 (89.59–128.79) > 48 134.77 (112.27–161.78) No. of primary care physicians seen 1–2 (reference) 3–4 0.95 (0.91–0.98) ≥ 5 0.82 (0.78–0.85) Usual provider continuity index (continuity of care) 1.31 (1.30–1.32) Physician level Sex Female (reference) Male 0.86 (0.77–0.95) Age group, yr < 35 1.44 (1.11–1.88) 35–44 1.34 (1.17–1.54) 45–54 (reference) 55–64 0.83 (0.74–0.94) ≥ 65 0.70 (0.60–0.81) Health authority Vancouver Coastal Health (reference) Interior Health 1.02 (0.85–1.23) Fraser Health 1.11 (0.97–1.26) Vancouver Island Health Authority 1.14 (0.94–1.37) Northern Health 1.32 (0.99–1.77) Total billings 1.00 (1.00–1.00) No. of patients 1.03 (1.02–1.03) % of eligible patients for whom incentives billed Q1 (reference) Q2 3.14 (2.60–3.80) Q3 14.25 (11.76–17.26) Q4 42.38 (34.55–52.00) Note: CI = confidence interval.
↵* All variables were included in a single model.
In this issue

Article tools


