


Article Figures & Tables
Figures
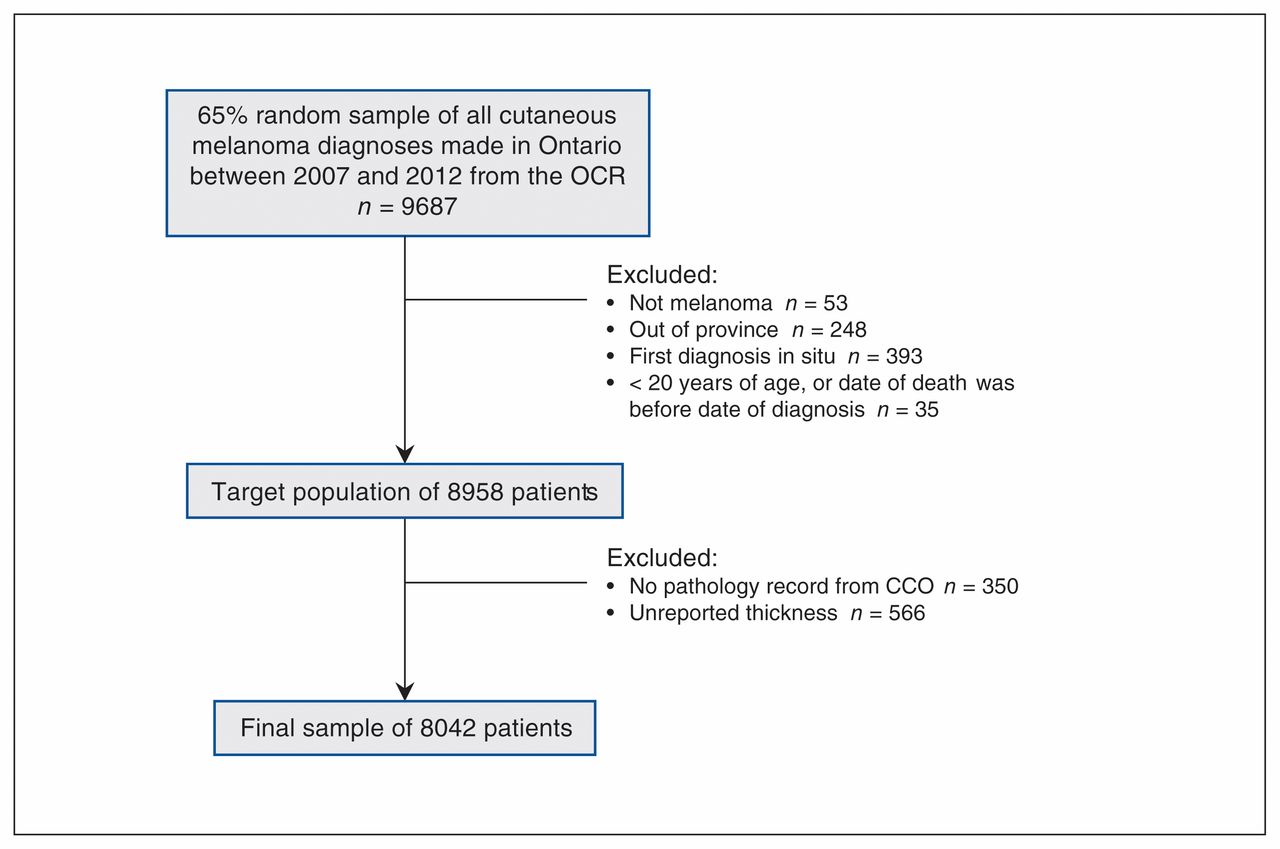
- Figure 1:
Flow diagram for selection of thickness-based study cohort. Note: CCO = Cancer Care Ontario, OCR = Ontario Cancer Registry.
- Figure 2:
Overall survival stratified by presence of advanced melanoma (> 2.0 mm thick). Five-year survival is 90% for patients with non-advanced melanoma and 56% for patients with advanced melanoma.


Tables
- Table 1:
Characteristics of the overall cohort with thickness information, and stratified by ulceration status
Characteristic Overall
n = 8042Ulceration absent
n = 6581Ulceration present
n = 1461Patient factors Sex, % Male 53.3 51.1 63.1 Female 46.7 48.9 36.9 Median age, yr (mean) 62 (61.52) 61 (60.28) 69 (67.09) Age group, % 20–45 yr 17.2 18.7 10.2 46–55 yr 18.5 19.5 13.6 56–65 yr 21.4 22.0 18.6 66–75 yr 20.1 19.7 21.9 76–85 yr 17.5 15.9 24.9 >85 yr 5.4 4.2 10.8 Material deprivation, % Least deprived 27.1 27.8 24.0 Quintile 2 23.8 23.6 24.9 Quintile 3 19.5 19.2 20.8 Quintile 4 14.2 13.8 16.0 Most deprived 9.0 8.4 11.8 Data missing 6.3 7.2 2.5 Health-system factors LHIN, % LHIN A 8.3 8.6 7.0 LHIN B 7.7 8.1 5.8 LHIN C 9.3 9.5 8.7 LHIN D 4.9 4.7 6.1 LHIN E 10.6 11.0 8.9 LHIN F 6.6 6.7 6.3 LHIN G 5.8 5.8 6.0 LHIN H 12.2 12.1 12.6 LHIN I 6.5 6.3 7.4 LHIN J 1.3 * * LHIN K 3.3 3.3 3.4 LHIN L 13.3 12.6 16.2 LHIN M 5.7 5.6 5.8 LHIN N 4.4 * * Median rurality† (mean) 5.0 (13.49) 5.0 (13.48) 5.0 (13.52) Rural (≥40), % 10.2 10.0 10.6 Non-major urban (9.01–39), % 26.2 26.3 26.2 Major urban (0–9), % 57.4 56.6 60.9 Data missing, % 6.3 7.1 2.4 Disease factors Median Breslow thickness (mean), mm 0.87 (2.02) 0.70 (1.28) 3.86 (5.34) T1 (≤1.0), % 55.7 66.8 6.0 T2 (> 1, ≤ 2.0), % 18.6 19.1 16.0 T3 (> 2.0, ≤ 4.0), % 13.1 9.0 31.3 T4 (>4.0), % 12.7 5.1 46.8 Histological subtype, % Superficial spreading 41.1 45.0 23.7 Lentigo maligna 8.1 9.3 2.7 Acral lentiginous 1.6 1.1 3.9 Nodular 13.2 7.3 39.8 NOS 31.8 33.7 23.4 Other 4.1 3.6 6.4 Body site, % Extremities 46.2 46.5 45.0 Face 12.4 12.6 11.7 Head and neck 5.7 5.3 7.7 Trunk 32.2 32.5 31.1 Unspecified 3.5 3.2 4.5 Presence of ulceration, % Present 18.2 – – Absent 81.8 – – Lymph node involvement, % Present 10.0 5.8 28.8 Absent 90.0 94.2 71.2 Distant metastases, % Present 1.2 0.8 3.2 Absent 98.8 99.2 96.9 - Table 2:
Presence of advanced melanoma (> 2.0 mm thickness) according to study factors, for the overall cohort and stratified by ulceration status
Characteristic Presence of advanced melanoma (> 2.0 mm thickness)* p value† Overall (n = 8042) Ulceration absent (n = 6581) Ulceration present (n = 1461) No. of patients with advanced melanoma (%) 2069 (25.7) 929 (14.1) 1140 (78.0) Patient factors Sex, % Overall: p < 0.001 Male 29.6 15.8 79.7 Abs v. pres: p < 0.001 Female 21.4 12.3 75.1 Age Overall: p < 0.001 Median age, yr (mean)‡ 69 (67.16) 67 (65.9) 71 (68.2) Abs v. pres: p < 0.001 Age group. % 20–45 yr 15.0 8.2 71.1 46–55 yr 19.4 11.0 73.9 56–65 yr 22.4 13.1 72.3 66–75 yr 27.0 14.9 75.9 76–85 yr 37.1 20.9 83.5 >85 yr 53.2 31.5 91.1 Material deprivation, % Overall: p < 0.001 Least deprived 22.9 12.8 75.2 Abs v. pres: p < 0.001 Quintile 2 25.3 12.9 78.5 Quintile 3 28.3 16.2 78.3 Quintile 4 30.0 17.8 77.4 Most deprived 35.1 19.8 83.8 Data missing 8.8 3.8 75.0 Health-system factors LHIN, % Overall: p < 0.001 LHIN A 21.3 11.3 77.5 Abs v. pres: p < 0.001 LHIN B 22.7 13.5 80.0 LHIN C 23.4 13.5 72.4 LHIN D 23.9 9.1 75.3 LHIN E 24.3 14.2 80.8 LHIN F 24.7 13.8 77.2 LHIN G 25.4 15.2 70.1 LHIN H 25.5 12.8 80.4 LHIN I 26.8 13.6 76.9 LHIN J 26.9 § § LHIN K 27.1 15.7 76.0 LHIN L 29.2 15.1 78.5 LHIN M 31.2 19.4 83.3 LHIN N 31.7 § § Rurality Overall: p < 0.001 Median rurality (mean)‡ 5.0 (13.4) 5.0 (13.3) 5.0 (13.5) Abs v. pres: p < 0.001 Rural (≥40), % 27.8 16.0 78.1 Non-major urban (9.01–39), % 25.7 14.5 76.7 Major urban (0–9), % 27.2 14.9 78.6 Data missing, % 9.2 4.1 77.1 Disease factors Histological subtype, % Overall: p < 0.001 Superficial spreading 13.6 8.0 61.9 Abs v. pres: p < 0.001 Lentigo maligna 9.3 6.5 52.5 Acral lentiginous 51.2 23.0 87.7 Nodular 77.9 63.0 90.2 NOS 18.9 10.6 72.8 Other 54.7 42.3 86.2 Body site, % Overall: p < 0.001 Extremities 24.6 13.2 77.7 Abs v. pres: p < 0.001 Face 25.5 15.4 74.3 Head and neck 38.9 24.0 84.8 Trunk 24.2 12.8 80.3 Unspecified 33.8 19.3 78.0 Presence of ulceration, % Overall: p < 0.001 Present 78.0 – – – Absent 14.1 – – – Lymph node involvement, % Overall: p < 0.001 Present 73.4 54.5 90.5 Abs v. pres: p < 0.001 Absent 20.4 11.6 73.0 Distant metastases, % Overall: p < 0.001 Present 61.5 38.0 87.0 Abs v. pres: p < 0.001 Absent 25.3 13.9 77.7 Note: Abs = absent, LHIN = local health integration network; pres = present.
↵* Percentages are calculated as 100% minus the percentage of patients with the same characteristic who had non-advanced melanoma.
↵† p values based on χ2 test.
↵‡ Values shown for median and mean are for the subset with advanced melanoma.
↵§ Censored because of small cell counts.
- Table 3:
Relative risk of advanced melanoma from modified Poisson regression, including results stratified by ulceration status
Variable Unstratified unadjusted model Unstratified adjusted model* Stratified adjusted model Ulceration absent† Ulceration present† RR (95% CI)
n = 8042RR: No interactions (95% CI)
n = 8042RR (95% CI)
n = 6581RR (95% CI)
n = 1461Patient factors Sex Male 1.38 (1.28–1.49) 1.12 (1.05–1.20) 1.14 (1.01–1.27) 1.08 (1.02–1.14) Female 1.00 (ref) 1.00 (ref) 1.00 (ref) 1.00 (ref) Age‡ 20–45 yr 0.67 (0.57–0.78) 0.83 (0.73–0.94) 0.75 (0.61–0.93) 1.01 (0.90–1.14) 46–55 yr 0.87 (0.76–0.99) 0.97 (0.87–1.09) 0.92 (0.77–1.12) 1.04 (0.94–1.16) 56–65 yr 1.00 (ref) 1.00 (ref) 1.00 (ref) 1.00 (ref) 66–75 yr 1.20 (1.07–1.36) 1.13 (1.03–1.25) 1.13 (0.95–1.34) 1.08 (0.98–1.18) 76–85 yr 1.66 (1.48–1.85) 1.27 (1.16–1.40) 1.40 (1.19–1.64) 1.15 (1.05–1.25) >85 yr 2.38 (2.10–2.69) 1.53 (1.37–1.72) 2.04 (1.68–2.49) 1.26 (1.16–1.37) Deprivation‡ Least deprived 1.00 (ref) 1.00 (ref) 1.00 (ref) 1.00 (ref) Quintile 2 1.11 (0.99–1.23) 1.05 (0.96–1.15) 0.99 (0.85–1.16) 1.05 (0.97–1.13) Quintile 3 1.24 (1.11–1.38) 1.12 (1.02–1.23) 1.24 (1.05–1.46) 1.03 (0.95–1.12) Quintile 4 1.31 (1.17–1.48) 1.14 (1.03–1.26) 1.19 (1.00–1.41) 1.01 (0.91–1.10) Most deprived 1.53 (1.35–1.74) 1.24 (1.12–1.38) 1.31 (1.08–1.58) 1.10 (1.01–1.20) Missing 0.39 (0.29–0.52) 0.56 (0.44–0.71) 0.40 (0.26–0.63) 1.01 (0.83–1.22) Health-system factors LHIN LHIN A 0.73 (0.62–0.87) 1.04 (0.90–1.19) 0.88 (0.69–1.14) 1.06 (0.94–1.19) LHIN B 0.78 (0.65–0.92) 1.08 (0.94–1.25) 1.04 (0.82–1.33) 1.06 (0.94–1.19) LHIN C 0.80 (0.68–0.94) 1.09 (0.95–1.24) 0.99 (0.79–1.25) 0.99 (0.88–1.12) LHIN D 0.82 (0.67–1.00) 1.00 (0.86–1.18) 0.76 (0.53–1.09) 1.06 (0.93–1.21) LHIN E 0.83 (0.72–0.97) 1.10 (0.97–1.24) 0.99 (0.79–1.24) 1.08 (0.98–1.20) LHIN F 0.85 (0.71–1.01) 1.09 (0.94–1.26) 0.98 (0.76–1.27) 1.06 (0.94–1.20) LHIN G 0.87 (0.73–1.04) 0.92 (0.79–1.07) 0.83 (0.65–1.06) 0.90 (0.78–1.03) LHIN H 0.87 (0.76–1.01) 1.05 (0.93–1.18) 0.95 (0.76–1.18) 1.06 (0.96–1.17) LHIN I 0.92 (0.77–1.09) 1.04 (0.91–1.19) 0.97 (0.75–1.27) 1.04 (0.93–1.16) LHIN J 0.92 (0.66–1.28) 1.20 (0.91–1.58) 1.15 (0.70–1.90) 1.07 (0.86–1.33) LHIN K 0.93 (0.75–1.15) 1.15 (0.96–1.38) 1.02 (0.77–1.36) 1.04 (0.88–1.23) LHIN L 1.00 (ref) 1.00 (ref) 1.00 (ref) 1.00 (ref) LHIN M 1.07 (0.91–1.26) 1.34 (1.16–1.54) 1.33 (1.04–1.70) 1.15 (1.03–1.29) LHIN N 1.09 (0.91–1.30) 1.27 (1.09–1.47) 1.25 (0.95–1.64) 1.13 (1.01–1.26) Rurality§ Major urban 1.00 (ref) – – – Non-major urban 0.95 (0.87–1.03) – – – Rural 1.02 (0.91–1.16) – – – Missing data 0.34 (0.25–0.45) – – – Disease factors Histology‡ Superficial 1.00 (ref) 1.00 (ref) 1.00 (ref) 1.00 (ref) Acral 3.76 (3.11–4.53) 2.15 (1.83–2.52) 2.52 (1.62–3.92) 1.40 (1.23–1.59) Lentigo maligna 0.69 (0.53–0.88) 0.67 (0.52–0.85) 0.63 (0.45–0.87) 0.86 (0.63–1.18) Nodular 5.72 (5.22–6.27) 2.84 (2.57–3.15) 6.60 (5.71–7.64) 1.45 (1.33–1.59) NOS 1.39 (1.23–1.56) 1.29 (1.16–1.44) 1.33 (1.12–1.58) 1.16 (1.04–1.29) Other 4.01 (3.52–4.57) 2.79 (2.45–3.18) 4.82 (3.97–5.87) 1.36 (1.21–1.52) Body site‡ Extremities 1.00 (ref) 1.00 (ref) 1.00 (ref) 1.00 (ref) Head and neck 1.58 (1.39–1.79) 1.17 (1.05–1.30) 1.36 (1.13–1.63) 1.05 (0.96–1.14) Face 1.03 (0.92–1.17) 0.97 (0.87–1.08) 1.05 (0.88–1.26) 0.92 (0.83–1.01) Trunk 0.98 (0.90–1.07) 0.97 (0.90–1.05) 0.96 (0.84–1.10) 1.00 (0.93–1.06) Unspecified 1.37 (1.15–1.63) 1.22 (1.05–1.42) 1.29 (1.01–1.66) 1.08 (0.95–1.23) Ulceration Present 5.53 (5.18–5.90) 3.22 (2.97–3.49) – – Absent 1.00 (ref) 1.00 (ref) – – Note: CI = confidence interval, LHIN = local health integration network, NOS = not otherwise specified, ref = reference, RR = relative risk.
↵* Controlled for sex, age, deprivation, LHIN, histology, site and ulceration.
↵† Controlled for sex, age, deprivation, LHIN, histology and site.
↵‡ Variable that had a significant interaction with ulceration.
↵§ Rurality was not included in the adjusted model.
In this issue

Article tools


Related Articles
Cited By...
- No citing articles found.