


Article Figures & Tables
Figures
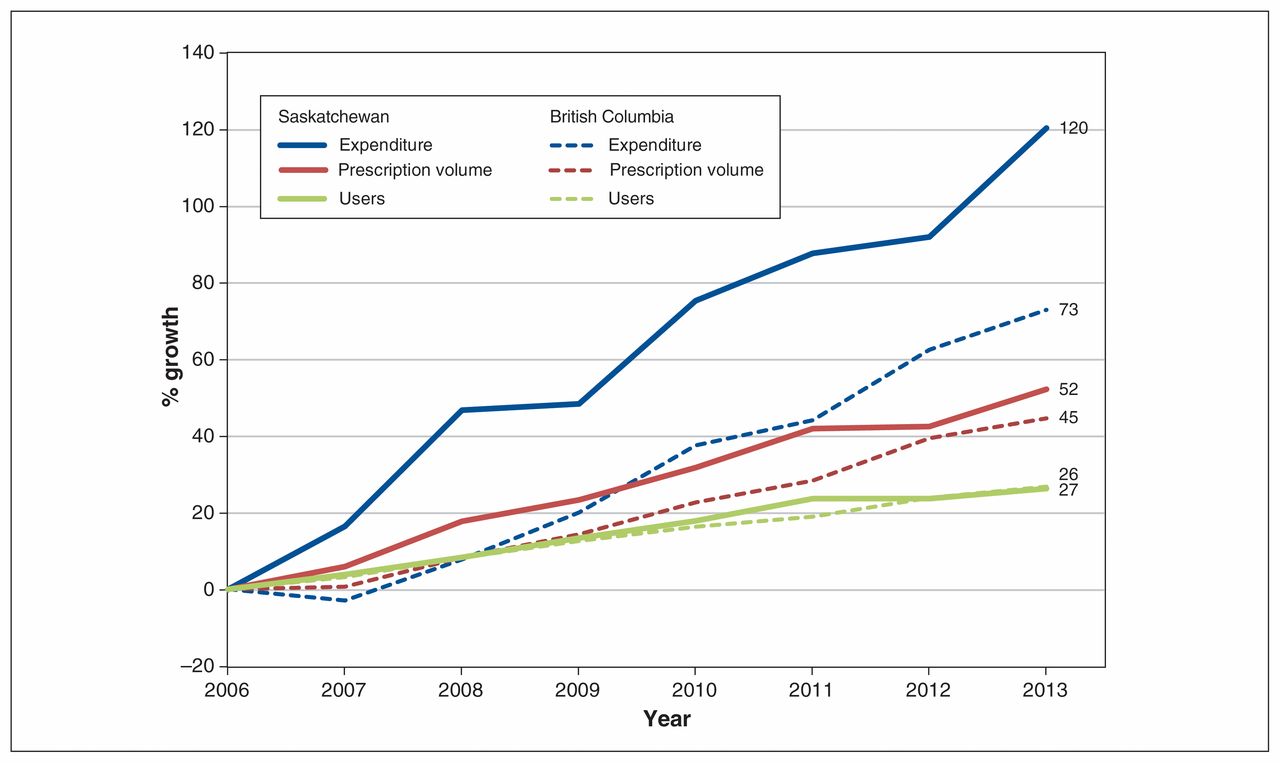
- Figure 1:
Unadjusted growth in number of users, prescriptions and expenditure in British Columbia and Saskatchewan, relative to 2006.
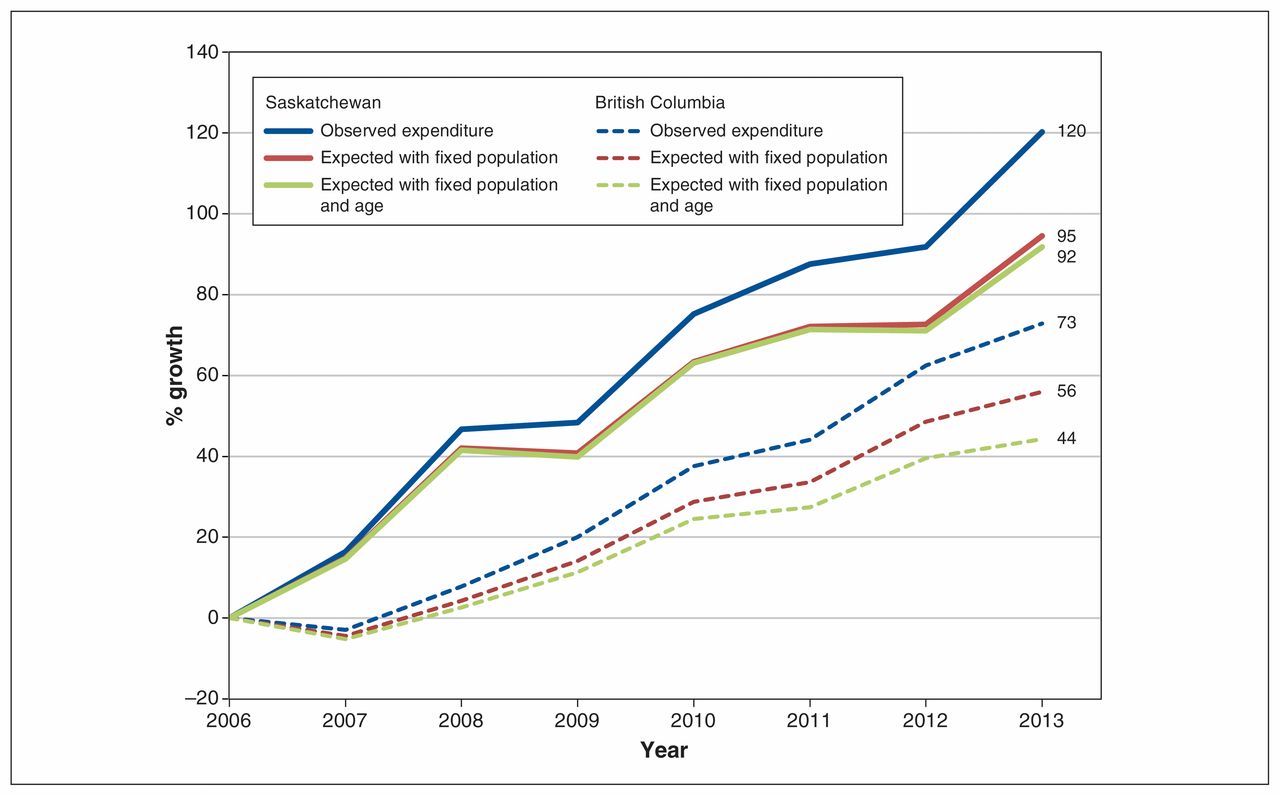
- Figure 2:
Growth in expenditure, adjusted for population growth and aging, in British Columbia and Saskatchewan, relative to 2006.


Tables
- Table 1:
Characteristics of unique dispensed systemic therapy prescriptions and systemic therapy recipients in British Columbia and Saskatchewan, 2006–2013
Characteristic British Columbia Saskatchewan No. (%) of prescriptions/recipients 95% CI No. (%) of prescriptions/recipients 95% CI Prescriptions 2 100 947 (100.0) 585 476 (100.0) Route of administration Oral 688 522 (32.8) 32.7 to 32.8 202 071 (34.5) 34.4 to 34.6 Intravenous/other 1 412 425 (67.2) 67.2 to 67.3 383 405 (65.5) 65.4 to 65.6 Indication Breast cancer 573 376 (27.3) 27.2 to 27.4 124 971 (21.3) 21.2 to 21.5 Colorectal cancer 420 224 (20.0) 19.9 to 20.1 176 161 (30.1) 30.0 to 30.2 Lung cancer 106 866 (5.1) 5.1 to 5.1 33 995 (5.8) 5.7 to 5.9 Prostate cancer 197 864 (9.4) 9.4 to 9.5 51 813 (8.8) 8.8 to 8.9 Other cancer 802 617 (38.2) 38.1 to 38.3 198 536 (33.9) 33.8 to 34.0 Recipients 103 680 (100.0) 23 108 (100.0) Sex Male 48 201 (46.5) 46.2 to 46.8 11 240 (48.6) 48.0 to 49.3 Female 55 479 (53.5) 53.2 to 53.8 11 868 (51.4) 50.7 to 52.0 Age, yr, mean ± SD Age, yr 64.9 ± 13.6 64.8 to 65.0 65.5 ± 13.3 65.3 to 65.7 < 50 13 619 (13.1) 12.9 to 13.3 2733 (11.8) 11.4 to 12.2 50–59 20 196 (19.5) 19.2 to 19.7 4453 (19.3) 18.8 to 19.8 60–69 28 377 (27.4) 27.1 to 27.6 6184 (26.8) 26.2 to 27.3 70–79 26 501 (25.6) 25.3 to 25.8 6385 (27.6) 27.1 to 28.2 ≥ 80 14 987 (14.4) 14.2 to 14.7 3353 (14.5) 14.1 to 15.0 Cancer site Breast 29 552 (28.5) 28.2 to 28.8 6059 (26.2) 25.7 to 26.8 Colorectal 9861 (9.5) 9.3 to 9.7 2354 (10.2) 9.8 to 10.6 Lung 7624 (7.4) 7.2 to 7.5 2081 (9.0) 8.6 to 9.4 Prostate 17 516 (16.9) 16.7 to 17.1 4233 (18.3) 17.8 to 18.8 Other 39 127 (37.7) 37.4 to 38.0 8381 (36.3) 35.6 to 36.9 Note: CI = confidence interval, SD = standard deviation.
Route of administration Component; % change (95% CI) Total expenditure per capita Cancer incidence per capita† Users per incident case Prescriptions per user Cost per prescription Total 6.6 (5.4 to 7.7) −0.4 (−1.1 to 0.3) 1.4 (0.8 to 2.1) 2.2 (1.7 to 2.7) 3.2 (2.5 to 3.9) Oral 13.1 (10.7 to 15.6) −0.4 (−1.1 to 0.3) 2.0 (1.4 to 2.6) 3.0 (2.7 to 3.3) 8.1 (6.0 to 10.2) Intravenous/other 3.8 (2.7 to 5.0) −0.4 (−1.1 to 0.3) 1.5 (0.8 to 2.2) 1.5 (1.0 to 2.0) 1.2 (0.6 to 1.9) Oral; cancer site Breast −11.4 (−17.8 to −4.5) 1.1 (0.1 to 2.2) 0.0 (−1.1 to 1.0) 0.9 (0.4 to 1.3) −13.0 (−19.1 to −6.6) Colorectum 5.7 (3.4 to 8.2) 0.3 (−0.4 to 0.9) 3.4 (1.7 to 5.1) 2.8 (1.6 to 3.9) −0.7 (−1.6 to 0.3) Lung 12.6 (9.7 to 15.6) −1.6 (−2.4 to −0.8) 8.5 (6.3 to 10.7) 1.3 (0.2 to 2.4) 4.0 (2.7 to 5.4) Prostate 26.4 (9.3 to 46.2) −4.0 (−5.7 to −2.4) 3.3 (1.8 to 4.8) 5.7 (4.3 to 7.2) 20.6 (4.8 to 38.7) Other 19.7 (15.1 to 24.4) 0.5 (−0.3 to 1.3) 3.2 (2.2 to 4.1) 4.3 (3.6 to 4.9) 10.7 (7.2 to 14.3) Intravenous/other; cancer site Breast −1.3 (−2.8 to 0.2) 1.1 (0.1 to 2.2) 0.9 (−0.3 to 2.0) −0.6 (−1.1 to −0.1) −2.6 (−3.4 to −1.8) Colorectum 6.1 (3.0 to 9.3) 0.3 (−0.4 to 0.9) 2.6 (1.4 to 3.8) −0.2 (−1.0 to 0.7) 3.4 (1.2 to 5.7) Lung 11.7 (8.2 to 15.3) −1.6 (−2.4 to −0.8) 1.0 (−0.4 to 2.4) 0.7 (0.5 to 0.9) 11.6 (8.5 to 14.7) Prostate −2.5 (−3.1 to −2.0) −4.0 (−5.7 to −2.4) 2.8 (1.6 to 3.9) 1.3 (1.0 to 1.6) −2.4 (−2.9 to −1.8) Other 8.0 (6.5 to 9.5) 0.5 (−0.3 to 1.3) 2.3 (1.2 to 3.3) 1.3 (0.5 to 2.1) 3.7 (2.5 to 5.0) Oral; patient age, yr < 50 7.4 (−14.5 to 34.9) 1.4 (0.4 to 2.3) 1.9 (1.4 to 2.4) 2.6 (2.2 to 3.0) 1.3 (−0.2 to 2.9) 50–59 11.8 (−5.5 to 32.3) 0.4 (−0.3 to 1.1) 1.1 (0.4 to 1.9) 3.0 (2.3 to 3.6) 6.9 (3.7 to 10.2) 60–69 14.5 (−1.9 to 33.6) −0.7 (−1.7 to 0.3) 2.3 (1.3 to 3.3) 2.9 (2.4 to 3.5) 9.4 (6.5 to 12.4) 70–79 16.1 (1.9 to 32.2) −0.4 (−1.1 to 0.2) 1.7 (1.2 to 2.2) 3.3 (3.0 to 3.7) 11.0 (8.7 to 13.4) ≥ 80 13.8 (0.9 to 28.3) −1.4 (−2.4 to −0.3) 2.5 (1.5 to 3.5) 3.1 (2.7 to 3.5) 9.2 (7.0 to 11.5) Intravenous/other; patient age, yr < 50 2.0 (−14.0 to 20.9) 1.4 (0.4 to 2.3) 0.3 (−0.7 to 1.4) −0.5 (−1.1 to 0.2) 0.8 (−0.2 to 1.8) 50–59 2.2 (−9.3 to 15.2) 0.4 (−0.3 to 1.1) 0.6 (−0.3 to 1.6) 0.1 (−0.6 to 0.7) 1.2 (0.2 to 2.1) 60–69 3.4 (−5.4 to 12.9) −0.7 (−1.7 to 0.3) 1.5 (0.5 to 2.6) 1.1 (0.7 to 1.6) 1.4 (0.5 to 2.4) 70–79 6.5 (−3.6 to 17.6) −0.4 (−1.1 to 0.2) 1.7 (1.2 to 2.2) 3.8 (3.3 to 4.3) 1.3 (0.5 to 2.0) ≥ 80 5.8 (−10.3 to 24.8) −1.4 (−2.4 to −0.3) 2.4 (1.5 to 3.4) 4.4 (3.0 to 5.9) 0.3 (−0.6 to 1.1) Route of administration Component; % change (95% CI) Total expenditure per capita Cancer incidence per capita† Users per incident case Prescriptions per use Cost per prescription Total 9.2 (7.2 to 11.2) 0.2 (−0.3 to 0.6) 1.9 (1.2 to 2.5) 2.2 (1.8 to 2.6) 4.7 (3.5 to 6.0) Oral 16.5 (13.6 to 19.6) 0.2 (−0.3 to 0.6) 2.0 (1.1 to 2.9) 3.2 (1.8 to 4.6) 10.6 (7.8 to 13.5) Intravenous/other 6.7 (4.6 to 8.8) 0.2 (−0.3 to 0.6) 2.0 (1.3 to 2.7) 1.4 (0.7 to 2.1) 2.9 (1.9 to 4) Oral; cancer site Breast 10.8 (4.9 to 17.1) 0.4 (−0.3 to 1.2) 3.0 (1.3 to 4.7) 2.0 (−0.3 to 4.2) 5.3 (−0.2 to 11.0) Colorectum 6.5 (2.7 to 10.4) 4.4 (3.0 to 5.8) 3.2 (0.0 to 6.5) 8.0 (5.8 to 10.2) −8.4 (−10.5 to −6.2) Lung 24.3 (4.0 to 48.5) 0.3 (−0.7 to 1.3) 4.0 (1.3 to 6.8) 0.4 (−1.1 to 2.0) 19.6 (0.8 to 41.9) Prostate 31.9 (12.0 to 55.4) −4.9 (−7.3 to −2.4) 3.2 (0.9 to 5.4) 1.4 (−1.6 to 4.5) 31.6 (12.9 to 53.4) Other 16.9 (13.0 to 21.0) 0.2 (−0.8 to 1.2) 1.2 (0.1 to 2.4) 4.2 (3.1 to 5.4) 10.6 (6.6 to 14.6) Intravenous; cancer site Breast −2.8 (−6.0 to 0.5) 0.4 (−0.3 to 1.2) −0.7 (−2.4 to 1.1) 0.4 (−0.9 to 1.6) −2.8 (−4.6 to −0.9) Colorectum 14.0 (7.8 to 20.6) 4.4 (3.0 to 5.8) −1.5 (−4.3 to 1.3) 0.2 (−0.8 to 1.2) 10.6 (6.8 to 14.6) Lung 11.8 (8.2 to 15.6) 0.3 (−0.7 to 1.3) 1.8 (−0.2 to 3.8) 1.5 (0.2 to 2.9) 7.8 (5.7 to 9.9) Prostate 1.0 (−1.0 to 3.0) −4.9 (−7.3 to −2.4) 6.1 (3.1 to 9.1) 4.1 (2.9 to 5.3) −3.7 (−5.1 to −2.4) Other 10.6 (8.8 to 12.4) 0.2 (−0.8 to 1.2) 4.1 (3.2 to 5.1) 1.3 (0.0 to 2.7) 4.6 (3.0 to 6.1) Oral; patient age, yr < 50 14.1 (−11.4 to 46.9) 1.6 (0.5 to 2.6) 3.9 (3.0 to 4.9) 1.9 (0.0 to 3.7) 5.6 (3.9 to 7.4) 50–59 13.5 (−6.5 to 37.9) −0.7 (−1.9 to 0.6) 3.5 (1.6 to 5.6) 3.9 (1.9 to 5.9) 6.5 (−0.6 to 14.2) 60–69 20.3 (3.7 to 39.5) −1.0 (−1.6 to −0.4) 4.6 (3.2 to 6.0) 3.6 (1.7 to 5.5) 12.1 (9.4 to 14.9) 70–79 18.7 (4.2 to 35.2) 1.0 (0.1 to 1.9) 0.6 (−0.7 to 2.0) 2.1 (0.6 to 3.5) 14.5 (12.7 to 16.3) ≥ 80 11.4 (−1.4 to 25.8) 0.6 (−0.4 to 1.7) −4.0 (−5.9 to −2.2) 1.6 (0.0 to 3.2) 13.8 (8.0 to 19.9) Intravenous; patient age, yr < 50 6.3 (−12.1 to 28.6) 1.6 (0.5 to 2.6) 0.8 (−0.3 to 1.9) 3.0 (1.2 to 4.7) 0.8 (−1.0 to 2.7) 50–59 7.4 (−4.3 to 20.4) −0.7 (−1.9 to 0.6) 2.8 (1.4 to 4.3) 2.2 (1.0 to 3.4) 2.8 (1.6 to 4.0) 60–69 6.5 (−1.6 to 15.1) −1.0 (−1.6 to −0.4) 2.8 (1.3 to 4.4) 1.0 (−0.4 to 2.4) 3.5 (2.5 to 4.5) 70–79 8.2 (−1.7 to 19.2) 1.0 (0.1 to 1.9) 1.8 (0.9 to 2.8) 0.6 (−0.9 to 2.2) 4.5 (3.2 to 5.8) ≥ 80 0.5 (−14.0 to 17.5) 0.6 (−0.4 to 1.7) 0.9 (−0.6 to 2.3) −2.3 (−4.6 to 0.1) 1.2 (−2.1 to 4.7)
In this issue

Article tools
Respond to this article


Related Articles
Cited By...
- No citing articles found.