


Article Figures & Tables
Figures
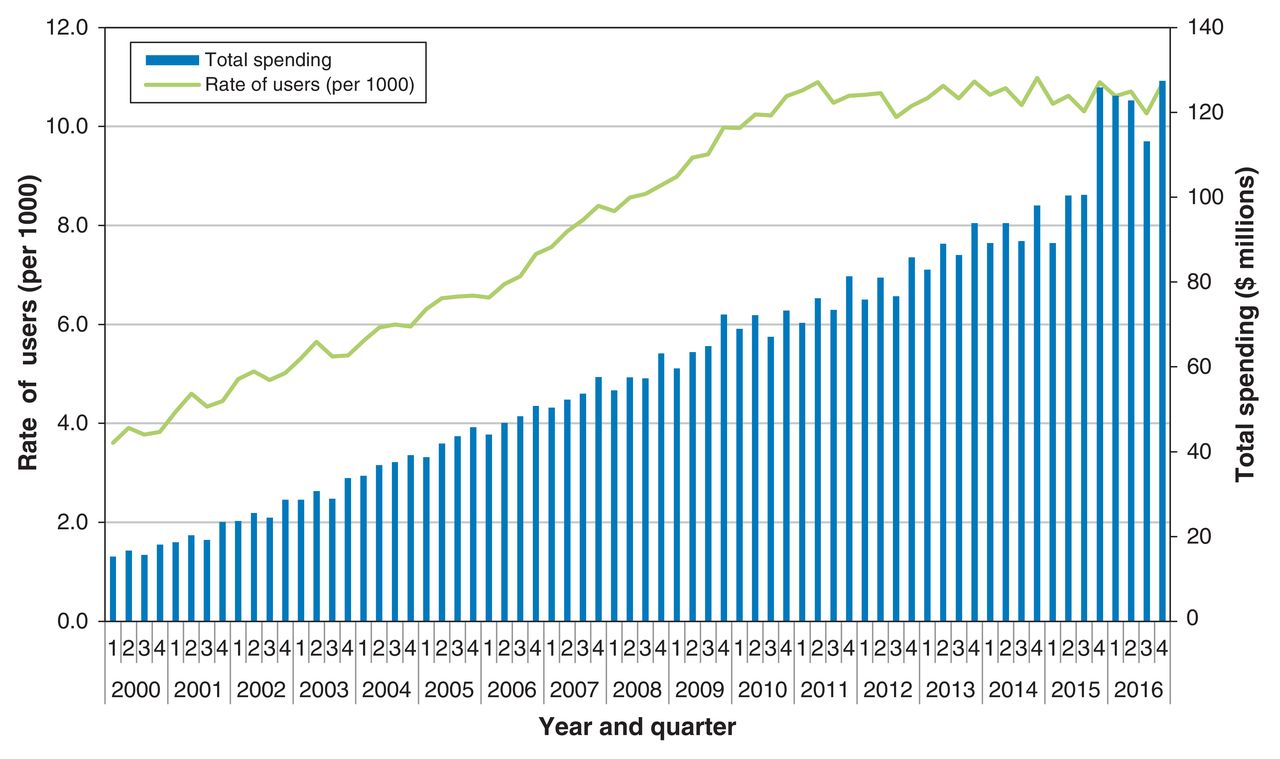
- Figure 1
Rate of Ontario Trillium Drug Program beneficiaries per 1000 and total program spending from 2000 to 2016, by year and quarter.
- Figure 2
Percentage of Ontario Trillium beneficiaries from 2000 to 2016 with any single claim over $1000, by year and quarter.


Tables
- Table 1: Characteristics of the Ontario Trillium Drug Plan and its beneficiaries in calendar years 2000, 2005, 2010 and 2015
Characteristic Year 2000 2005 2010 2015 No. of TDP recipients 55 571 95 296 162 301 176 299 No. of TDP recipients surpassing deductible, n (%) 51 320 (92.4) 90 564 (95.0) 150 229 (92.6) 163 140 (92.5) Total TDP spending, $ 65 717 445 170 049 300 281 546 814 416 019 977 Average annual cost per recipient surpassing deductible, $ 1281 1878 1874 2550 Median age, yr (Q1-Q3) 53 (43-63) 53 (43-63) 52 (41-63) 52 (40-64) Age category, yr, n (%) 0-24 7507 (13.5) 14 099 (14.8) 27 020 (16.6) 30 943 (17.6) 25-34 3387 (6.1) 5554 (5.8) 10 633 (6.6) 13 504 (7.7) 35-49 11 849 (21.3) 20 286 (21.3) 34 194 (21.1) 35 024 (19.9) 50-64 32 828 (59.1) 55 357 (58.1) 90 454 (55.7) 96 828 (54.9) No. of drugs, n (%) 1 5,773 (11.2) 10 942 (12.1) 21 460 (14.3) 29 662 (18.2) 2 5,765 (11.2) 10 373 (11.5) 18 115 (12.1) 19 731 (12.1) ≥ 3 39 782 (77.5) 69 249 (76.5) 110 654 (73.7) 113 747 (69.7) Sex, male, n (%) 22 767 (41.0) 39 801 (41.8) 69 976 (43.1) 77 551 (44.0) Income quintile, n (%) 1 (lowest) 14 838 (26.7) 26 628 (27.9) 44 417 (27.4) 45 789 (26.0) 2 13 465 (24.2) 22 366 (23.5) 37 289 (23.0) 40 225 (22.8) 3 10 856 (19.5) 18 212 (19.1) 32 319 (19.9) 35 898 (20.4) 4 9183 (16.5) 15 751 (16.5) 27 847 (17.2) 31 493 (17.9) 5 (highest) 7127 (12.8) 12 123 (12.7) 20 082 (12.4) 22 492 (12.8) Charlson Comorbidity Index score, n (%) No hospital admission 35 058 (68.3) 66 600 (73.5) 117 491 (78.2) 131 290 (80.5) 0 7869 (15.3) 12 514 (13.8) 16 238 (10.8) 15 572 (9.6) 1 3873 (7.6) 5242 (5.8) 6886 (4.6) 6523 (4.0) ≥ 2 4520 (8.8) 6208 (6.9) 9614 (6.4) 9755 (6.0) Single claims > $1000 1757 (3.4) 5170 (5.7) 10 021 (6.7) 17 015 (10.4) Any biologic use 4119 (8.0) 8397 (9.3) 15 985 (10.6) 21 779 (13.4) High-cost biologics 807 (1.6) 2711 (3.0) 5061 (3.4) 8952 (5.5) Deductible, n (%) Low (< $350) 50 180 (97.8) 86 055 (95.0) 139 489 (92.9) 150 092 (92.0) Med ($351-499) 699 (1.4) 2468 (2.7) 5595 (3.7) 5895 (3.6) High (> $500) 441 (0.9) 2041 (2.3) 5145 (3.4) 7153 (4.4) Median deductible, $ 42 65 69 58 Note: All characteristics were found to be statistically significant for tests of trend from 2000 to 2015 (p < 0.05). TDP = Trillium Drug Plan.
Rank Year 2000 2005 2010 2015 Top drugs by frequency of use, n* (%) 1 APAP, caffeine and codeine
9119 (16.4)Atorvastatin
18 014 (18.9)Metformin
26 486 (16.3)Rosuvastatin
27 452 (15.6)2 Amoxicillin
7367 (13.3)APAP, caffeine and codeine
14 069 (14.8)Atorvastatin
24 940 (15.4)Amoxicillin
24 686 (14.0)3 Estrogen
7097 (12.8)Amoxicillin
13 437 (14.1)Amoxicillin
23 214 (14.3)Metformin
23 990 (13.6)4 Atorvastatin
6293 (11.3)Metformin
13 321 (14.0)Rosuvastatin
22 419 (13.8)Atorvastatin
19 859 (11.3)5 Ranitidine
6260 (11.3)Ramipril
13 207 (13.9)APAP, caffeine and codeine
18 459 (11.4)Albuterol
19 571 (11.1)6 Albuterol
5575 (10.0)Albuterol
10 226 (10.7)Ramipril
17 330 (10.7)Levothyroxine
16 865 (9.6)7 Lorazepam
5427 (9.8)Hydrochlorothiazide
10 023 (10.5)Albuterol
17 016 (10.5)APAP, caffeine and codeine
14 435 (8.2)8 Levothyroxine
5283;(9.5)Levothyroxine
9141 (9.6)Levothyroxine
15 297 (9.4)Amlodipine
14 258 (8.1)9 Metformin
4862 (8.7)Lorazepam
8183 (8.6)Rabeprazole
13 904 (8.6)Pantoprazole
13 868 (7.9)10 Glyburide
4292 (7.7)Amlodipine
7702 (8.1)Amlodipine
13 418 (8.3)Ramipril
12 380 (7.0)Top drugs by total spending, $† (%) 1 Atorvastatin
2 600 000 (4.0)Infliximab
10 450 000 (6.1)Infliximab
31 830 000 (11.3)Infliximab
55 370 000 (13.3)2 Interferon α2b and ribavirin
2 240 000 (3.4)Atorvastatin
7 900 000 (4.6)Etanercept
11 070 000 (3.9)Ledipasvir and sofosbuvir
24 620 000 (5.9)3 Interferon β
2 080 000 (3.2)Interferon β1a
7 000 000 (4.1)Interferon β1a
9 339 000 (3.3)Adalimumab
23 520 000 (5.7)4 Interferon β1a
2 050 000 (3.1)Imatinib
4 980 000 (2.9)Oxycodone
8 180 000 (2.9)Etanercept
14 340 000 (3.4)5 Omeprazole
1 970 000 (3.0)Etanercept
4 700 000 (2.8)Adalimumab
8 100 000 (2.9)Tenofovir
10 900 000 (2.6)6 Olanzapine
1 710 000 (2.6)Olanzapine
3 920 000 (2.3)Imatinib
$6 900 000 (2.5)Eculizumab
10 040 000 (2.4)7 Lamivudine
1 700 000 (2.6)Lamivudine and zidovudine 3 280 000 (1.9) Rosuvastatin
6 500 000 (2.3)Interferon β1a
73 760 000 (1.8)8 Nelfinavir
1 420 000 (2.2)Oxycodone
3 250 000 (1.9)Atorvastatin
6 420 000 (2.3)Efavirenz, emtricitabine and tenofovir
71 010 000 (1.7)9 Stavudine
1 400 000 (2.1)Ramipril
3 060 000 (1.8)Efavirenz, emtricitabine and tenofovir
6 350 000 (2.3)Sofosbuvir
6 740 000 (1.6)10 Lamivudine and zidovudine
1 360 000 (2.1)Omeprazole
3 040 000 (1.8)Abacavir and lamivudine
5 000 000 (1.8)Lenalidomide
6 720 000 (1.6)Note: APAP = acetaminophen.*No. of users.†Dollar values reported to the nearest $10 000.
In this issue

Article tools
Respond to this article


