


Article Figures & Tables
Figures
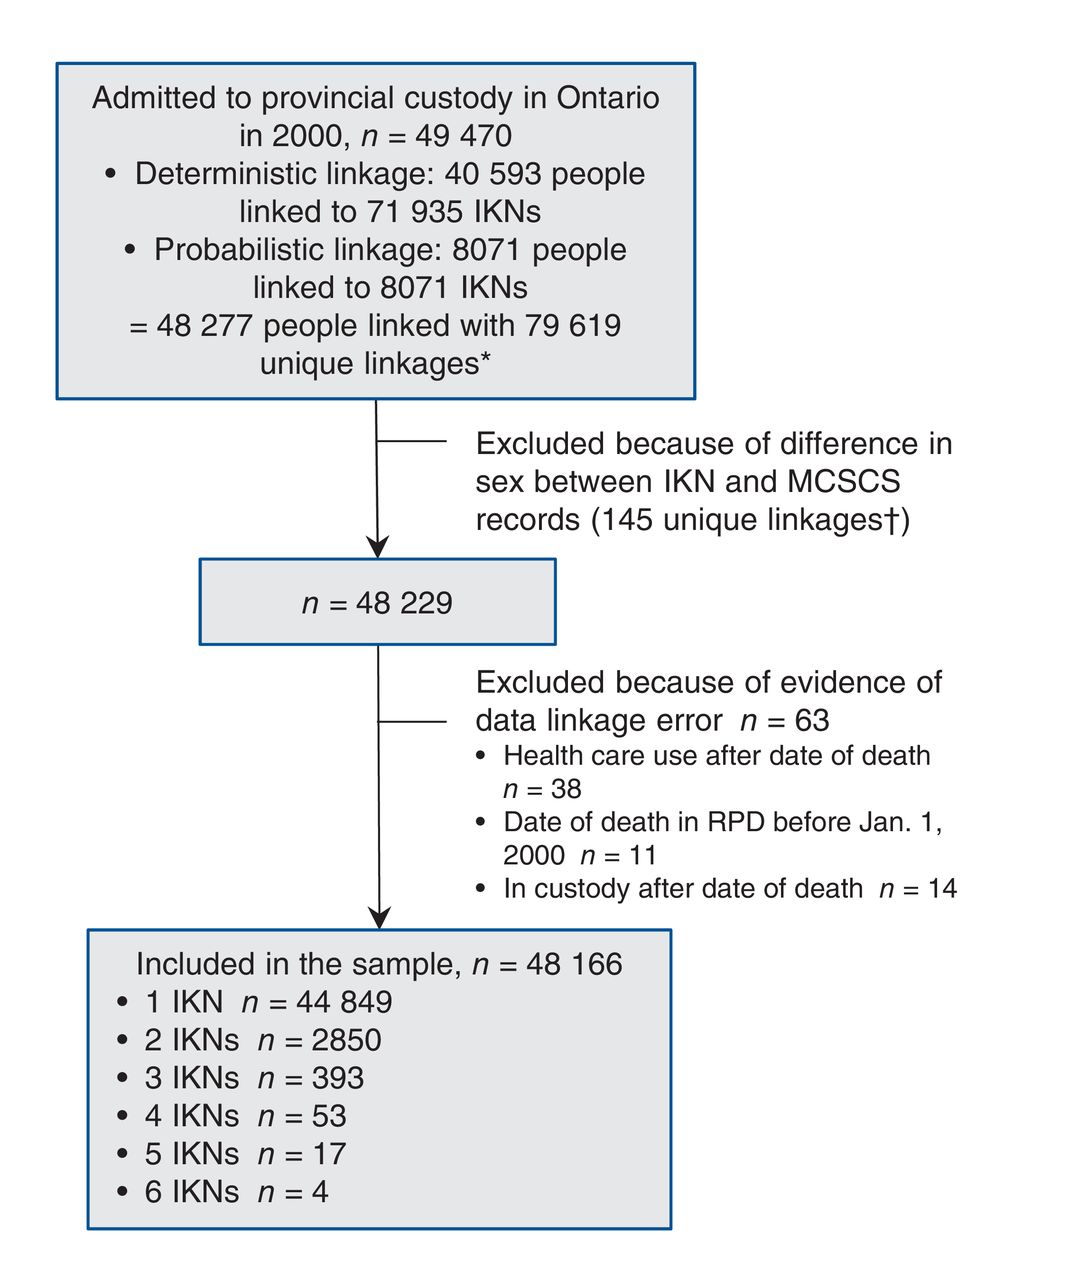
- Figure 1
Flow diagram of inclusion in final sample of people admitted to provincial custody in Ontario in 2000. Note: IKN = a unique encrypted health card number, MCSCS = Ontario Ministry of Community Safety and Correctional Services, RPD = Registered Persons Database. *Numbers of people and of IKNs do not sum because of overlap in people and IKNs from deterministic and probabilistic linkage. †This number represents the number of combinations of people and IKNs.
- Figure 2
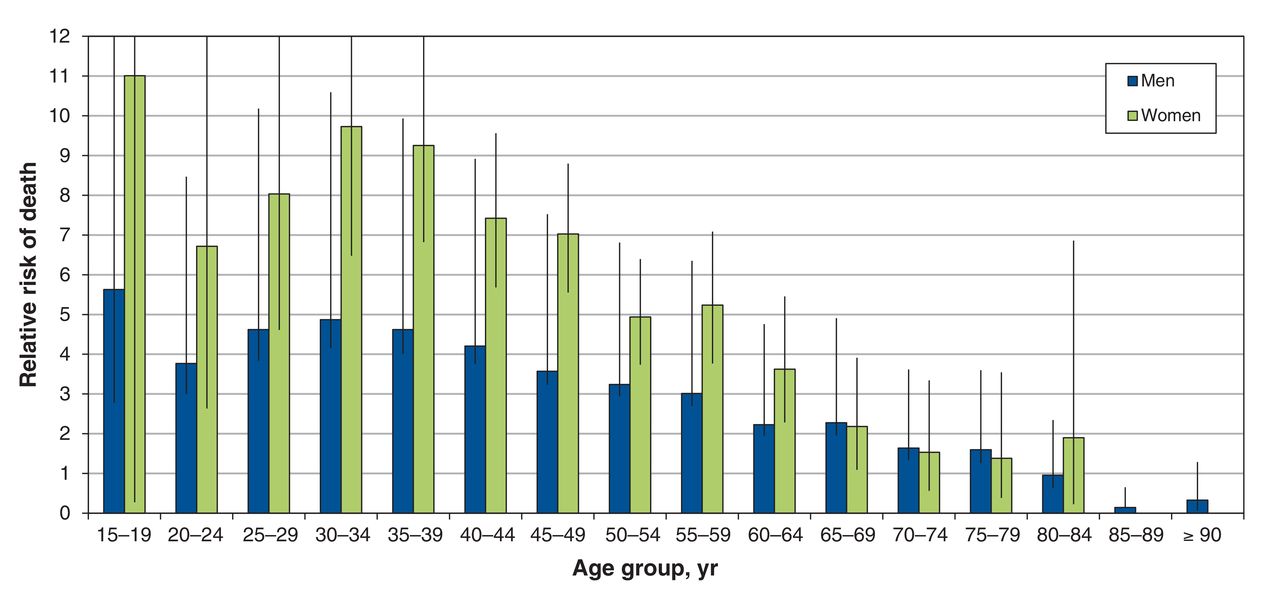
Relative risk of death in people admitted to provincial custody in 2000 compared with the general population,* by age group and sex. 95% confidence intervals shown with vertical lines. *Death rates between 2000 and 2012 for those incarcerated in 2000 and for the Ontario population aged 15 and older in 2006.
- Figure 3
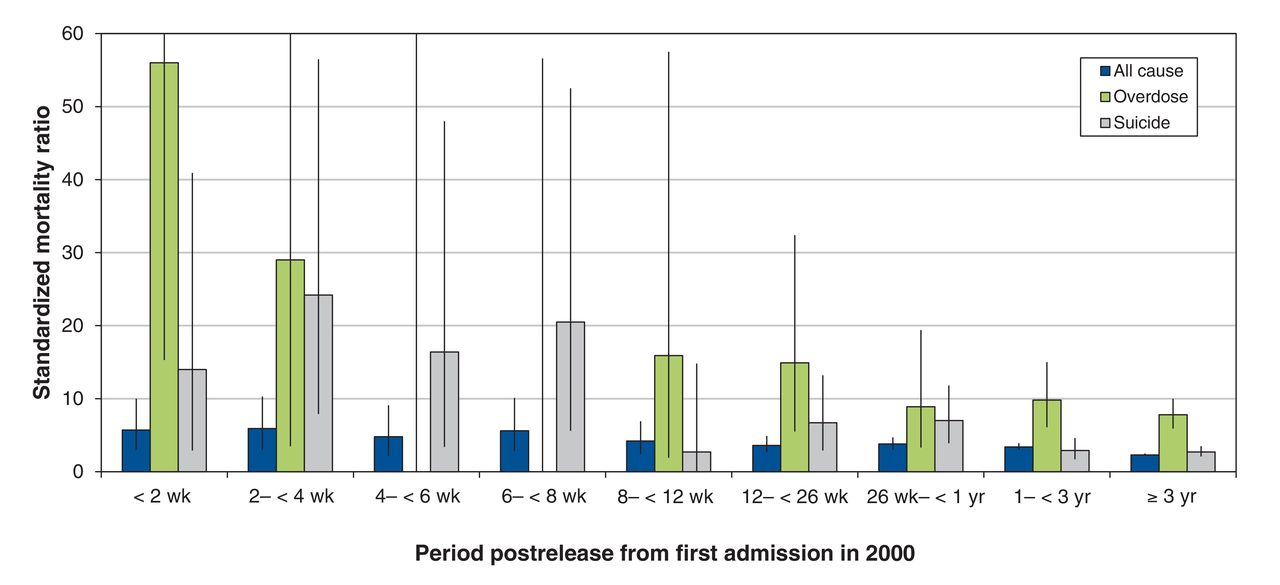
Standardized mortality ratio for all causes, overdose and suicide, by period postrelease from first admission to provincial custody in 2000, n = 46 442.* Standardized to the Canadian population in 2000. 95% confidence intervals shown with vertical lines. *Excludes 960 people who were transferred to federal custody.


Tables
- Table 1: Characteristics and rates of death between 2000 and 2012 in people admitted to provincial correctional facilities in Ontario in 2000 (n Table 1: Characteristics and rates of death between 2000 and 2012 in people admitted to provincial correctional facilities in Ontario in 2000 (n = 48 166)
Characteristic Men Women No. (% of men) Person-years Mortality per 1000 person-years No. (% of women) Person-years Mortality per 1000 person-years All 43 419 (100) 522 742.3 7.1 4747 (100) 57 260.9 7.3 Age at baseline, yr 15-19 4054 (9.3) 50 046.6 2.6 411 (8.7) 5095.6 1.8 20-24 8257 (19.0) 101 957.8 2.7 752 (15.8) 9273.0 2.6 25-29 6349 (14.6) 77 710.5 4.0 684 (14.4) 8389.9 4.2 30-34 6942 (16.0) 84 628.7 4.9 878 (18.5) 10 695.1 5.9 35-39 6936 (16.0) 83 512.4 7.2 901 (19.0) 10 734.8 9.0 40-44 5009 (11.5) 59 340.1 10.5 567 (11.9) 6711.4 11.3 45-49 2805 (6.5) 32 486.1 14.4 306 (6.4) 3521.9 16.5 50-54 1565 (3.6) 17 658.8 18.7 117 (2.5) 1350.2 17.8 55-59 771 (1.8) 8274.2 28.5 74 (1.6) 851.3 17.6 60-64 395 (0.9) 3967.5 40.1 32 (0.7) 360.2 25.0 65-69 206 (0.5) 1965.9 50.4 21 (0.4) 231.8 25.9 70-74 85 (0.2) 793.4 51.7 ≤ 5* (≤ 0.1) 45.5 ≤ 109.8* 75-79 37 (0.1) 331.2 54.3 0 (0.0) - - ≥ 80 8 (0.0) 69.1 ≤ 72.4* 0 (0.0) - - Race Aboriginal 3005 (6.9) 35 972.0 8.4 460 (9.7) 5468.6 9.0 Black 5374 (12.4) 66 137.4 3.1 596 (12.6) 7367.3 2.0 Declined to specify 47 (0.1) 583.4 ≤ 8.6* ≤ 5* (≤ 0.1) 37.0 0.0 East Asian 545 (1.3) 6682.8 3.7 35 (0.7) 435.2 0.0 Hispanic 392 (0.9) 4817.7 2.9 28 (0.6) 347.0 ≤ 14.4* Other 1431 (3.3) 17 625.6 3.1 124 (2.6) 1527.1 ≤ 3.3* South Asian 897 (2.1) 10 922.4 4.6 54 (1.1) 665.2 ≤ 7.5* Southeast Asian 725 (1.7) 8872.6 4.2 70 (1.5) 877.1 ≤ 5.7* Unknown 454 (1.0) 5470.4 5.3 72 (1.5) 869.1 9.2 West Asian/Arab 572 (1.3) 7100.6 2.3 26 (0.5) 324.3 0.0 White 29 977 (69.0) 358 557.4 8.3 3279 (69.1) 39 342.8 8.6 Neighbourhood income quintile Missing 7862 (18.1) 96 907.8 3.3 910 (19.2) 11 200.8 3.9 1 (lowest) 13 336 (30.7) 159 367.3 8.3 1693 (35.7) 20 362.9 7.6 2 8381 (19.3) 100 458.6 7.9 858 (18.1) 10 302.9 8.7 3 5892 (13.6) 70 743.8 7.4 573 (12.1) 6920.5 7.4 4 4674 (10.8) 56 102.0 7.8 393 (8.3) 4698.7 8.7 5 (highest) 3274 (7.5) 39 162.8 8.1 320 (6.7) 3775.0 10.1 Admissions to provincial custody 2000-2012 1 14 238 (32.8) 169 333.2 7.8 1885 (39.7) 22 714.8 5.9 2-4 14 678 (33.8) 175 775.7 7.6 1392 (29.3) 16 653.5 8.0 ≥ 5 14 503 (33.4) 177 633.4 5.9 1470 (31.0) 17 892.6 8.3 Transferred to federal facility 2000-2012 No 38 680 (89.1) 464 590.0 7.4 4480 (94.4) 53 968.8 7.5 Yes 4739 (10.9) 58 152.2 4.8 267 (5.6) 3292.1 3.3 Total time in provincial custody 2000-2012 < 1 wk 8006 (18.4) 95 893.8 6.5 1358 (28.6) 16 406.6 5.4 1 wk to < 1 mo 5676 (13.1) 67 742.7 7.8 863 (18.2) 10 251.7 8.5 1 mo to < 3 mo 6971 (16.1) 82 747.9 8.6 787 (16.6) 9436.5 8.5 3 mo to < 6 mo 6072 (14.0) 72 872.6 7.6 628 (13.2) 7479.5 10.0 6 mo to < 1 yr 6132 (14.1) 73 685.2 7.9 534 (11.2) 6514.6 7.8 1 yr to < 2 yr 5384 (12.4) 65 483.8 6.8 395 (8.3) 4895.8 5.5 2 yr to < 3 yr 2445 (5.6) 30 188.5 4.9 114 (2.4) 1430.7 4.9 ≥ 3 yr 2733 (6.3) 34 127.7 3.5 68 (1.4) 845.4 ≤ 5.9* *To decrease the risk of identifying individuals, we indicated ≤ 5 as the number of people and used 5 as the numerator to calculate the percentage in cells in which there were 5 or fewer persons, and we used 5 as the numerator to calculate mortality in categories in which there were 5 or fewer deaths.
- Table 2: Observed and expected* deaths between 2000 and 2012 for people admitted to provincial correctional facilities in Ontario in 2000, by ICD-9 chapter and for selected preventable causes of death
Cause of death Observed deaths, no. Expected deaths, no. Standardized mortality ratio (95% CI) Mean age at death, yr All deaths† 4126 1037 4.0 (3.9-4.1) 47.5 Cause unknown 130 - - 43.4 By ICD-9 chapter 1. Infectious and parasitic diseases 224 30.2 7.4 (6.5-8.5) 48.2 HIV 96 11.4 8.5 (6.9-10.3) 43.3 Sepsis 24 7.5 3.2 (2.1-4.8) 56.3 Viral hepatitis 87 6.4 13.5 (10.8-16.7) 51.1 2. Neoplasms 600 380.3 1.6 (1.5-1.7) 56.1 Breast‡ 7 7.5 0.9 (0.4-1.9) 54.7 Cervix‡ ≤ 5** ** 3.6 (1.0-9.3) 41.0 Colon, rectum and anus 37 35.9 1.0 (0.7-1.4) 60.8 3. Endocrine, nutritional and metabolic diseases, and immunity disorders 120 39.2 3.1 (2.5-3.7) 52.4 Diabetes 90 27.3 3.3 (2.7-4.1) 53.3 4. Diseases of the blood and blood-forming organs ≤ 5** ** 0.5 (0.1-1.9) 44.5 5. Mental disorders 174 20.5 8.5 (7.3-9.9) 47.5 6. Diseases of the nervous system and sense organs 61 36.3 1.7 (1.3-2.2) 49.2 Epilepsy 19 3.7 5.2 (3.1-8.1) 46.3 7. Diseases of the circulatory system 653 212.9 3.1 (2.8-3.3) 54.3 Cerebrovascular disease 80 32.1 2.5 (2.0-3.1) 54.8 Hypertensive disease 15 5.1 3.0 (1.7-4.9) 52.1 Ischemic heart disease 416 123.6 3.4 (3.1-3.7) 55.7 8. Diseases of the respiratory system 135 46.5 2.9 (2.4-3.4) 56.4 Pneumonia 39 12.5 3.1 (2.2-4.3) 55.1 9. Diseases of the digestive system 303 48.3 6.3 (5.6-7.0) 51.5 10. Diseases of the genitourinary system 18 11.4 1.6 (0.9-2.5) 57.7 12. Diseases of the skin and subcutaneous tissue ≤ 5** ** 3.1 (0.6-9.0) 59.3 13. Diseases of the musculoskeletal system and connective tissue ≤ 5** ** 0.3 (0.0-1.1) 62.5 14. Congenital anomalies ≤ 5** ** 0.1 (0.0-0.8) 50.0 16. Symptoms, signs, and ill-defined conditions 123 32.6 3.8 (3.1-4.5) 43.0 17. Injury and poisoning 1575 226.4 7.0 (6.6-7.3) 39.9 Accidental falls 59 8.8 6.7 (5.1-8.7) 50.2 Events of undetermined intent 132 15.2 8.7 (7.3-10.3) 40.5 Excessive cold 11 1.3 8.6 (4.3-15.4) 47.3 Homicide 169 11.4 14.8 (12.7-17.2) 33.2 Legal intervention 10 0.3 37.0 (17.8-68.1) 34.0 Overdose 563 27.7 20.3 (18.7-22.1) 41.4 Suicide and self-inflicted injury 340 78.4 4.3 (3.9-4.8) 39.4 By risk factor§ Alcohol-related diseases 243 6.1 40.0 (35.2-45.4) 51.8 Drug-related diseases¶ 58 4.0 14.5 (11.0-18.7) 42.5 Smoking-related diseases 337 52.5 6.4 (5.8-7.1) 57.9 Note: CI = confidence intervals. ICD-9 = International Classification of Diseases, 9th revision.
*Expected rates are adjusted for age, and we used age groups of 5 years for people aged ≥ 15 in Canada in 2006, unless otherwise specified.
†Standardized to the Ontario population in 2006.
‡Includes women only.
§These are diseases that are attributable in whole or in part to the risk factor as defined by Statistics Canada,41 and these data include people aged 25 and older only.
¶For some age strata, the number of deaths was too low for Statistics Canada to report (i.e., < 5), and we assumed the maximum number of 4 expected deaths to provide the most conservative estimate of the standardized mortality ratio.
**To decrease the risk of identifying individuals, we indicated ≤ 5 in cells in which there were 5 or fewer observed deaths and left the number of expected deaths blank.
In this issue

Article tools


Related Articles
Cited By...
- Development and validation of a population-based risk algorithm for premature mortality in Canada: the Premature Mortality Population Risk Tool (PreMPoRT)
- Burden of opioid toxicity death in the fentanyl-dominant era for people who experience incarceration in Ontario, Canada, 2015-2020: a whole population retrospective cohort study
- Rates of opioid agonist treatment prescribing in provincial prisons in Ontario, Canada, 2015-2018: a repeated cross-sectional analysis
- Fatal overdoses after release from prison in British Columbia: a retrospective data linkage study
- Age-specific incidence of injury-related hospital contact after release from prison: a prospective data-linkage study