


Abstract
Background Hepatitis C virus (HCV) infection has a high likelihood of becoming chronic and lead to a range of conditions with poor health outcomes. Identifying birth groups highly affected by HCV infection may better focus public health interventions and ensure their cost-effectiveness. Our analysis focused on studying the association of the birth year and reporting period with rates of cases of HCV infection reported in Canada over a 20-year period.
Methods Laboratory-confirmed acute or chronic HCV cases with information on sex, age and year of report from 6 provinces and territories that reported line-listed data to the Canadian Notifiable Diseases Surveillance System from 1991 to 2010 were used. Sex-specific infection rates for 5-year birth groups born between 1921 and 1990 were calculated. Rates of HCV infection were log-logit transformed and underwent mean polish analysis and panel linear regression. Rate ratios of HCV infection in the 5-year age groups and their 95% confidence intervals were calculated, with rates in males and females born in 1941–1945 used as references.
Results Males born between 1946 and 1970 had 21%−40% higher reported rates of HCV infection, whereas females born between 1946 and 1975 had 12%−43% higher reported rates compared with rates in the respective sexes who were born in 1941–1945.
Interpretation Individuals born between 1946 and 1965 contributed the most to the rates of HCV infection reported in Canada between 1991 and 2010. The cohort effect was present in male and female cases of HCV infection with birth year up to 1970 and 1975, respectively. Our findings will support the development of HCV prevention programs and policies in Canada.
Increasingly, surveillance systems are not just for describing trends in the disease spread in terms of person, time and space, but are being used in more elaborate analyses to answer questions about the underlining reasons for these trends.1,2 One way to analyze rich historical data is to perform the age-period-cohort analysis, although methodological issues and interpretation difficulties affected the usability of this approach in the past.3
Hepatitis C virus (HCV) infection has a high likelihood of becoming chronic and lead to a range of conditions with poor health outcomes. In early 2012, the United States Centers for Disease Control and Prevention reported increasing mortality from HCV4 and suggested that screening “baby boomers” (those born between 1945 and 1965), who may be heavily affected by HCV, may not just be feasible but also cost effective.5 Although work is currently underway to revise screening guidelines for HCV infection in Canada, identifying birth cohorts that have the potential to be highly affected by HCV morbidity may provide a better focus for public health interventions and ensure their cost-effectiveness.
In Canada, HCV infection has been nationally notifiable since 1991, although data on HCV cases was not reported by all provinces and territories until 1999.6,7 Until recently, information about HCV infections has been limited to national routine and enhanced surveillance data,8–11 findings of regional or province-specific studies,12–14 serosurveys of subpopulations such as blood donors15 and inmates,16,17 and modelled estimates.18 With the launch of the Canadian Health Measures Survey in 2007, direct measures of anti-HCV prevalence in a nationally representative household sample were made available in Canada.19 The purpose of this analysis was to study the association of birth year and reporting period with rates of reported HCV cases in the Canadian Notifiable Diseases Surveillance System of the Public Health Agency of Canada and to describe the findings in the context of the HCV transmission risk.
Methods
Sources of data
The analysis is based on a subset of confirmed and unspecified (i.e., laboratory confirmed according to the HCV case definition20 where acute and chronic infections are not specified) cases of HCV infection reported to Canadian Notifiable Diseases Surveillance System by 6 provinces and territories that submitted line-listed data from 1991 to 2010. Cases contained information on sex, age, year of report and reporting jurisdiction. Year of birth was generated as the difference between the year of report and reported age. Sex-specific population rates for 5-year age groups born in 1921–1990 were calculated per 100 000 population by dividing age- and sex-specific cases of HCV infection reported over a 5-year period by the corresponding estimates of age- and sex-specific populations in Canada.21 Because of a considerable difference in the reported HCV rates among males and females, all analyses were done on sex-stratified subsets of the data. Table 1 summarizes the data used in the analysis.
Statistical analyses
Reported rates for 5-year birth groups were log-logit-transformed and residuals from the mean polish analysis,22 in which cohort and period mean values are subtracted from log-logit-transformed rates, were plotted against birth groups in an MS Excel spreadsheet to establish the presence of the cohort effect. Birth groups of males and females born in 1941–1945 were used as reference groups for the calculation of rate ratios. The reference groups were chosen to distinguish birth groups of baby boomers from individuals born before and after the baby boom period.
The cohort effect in birth groups was modelled as an interaction term of birth group and reporting period on the understanding of the cohort effect being a multiplicative interaction between age and period.3 Because of high collinearity of the data (i.e., birth year is related to diagnosis year through age), fixed-effects panel linear regression was chosen to describe the cohort effect in the birth groups because of its resiliency to confounding caused by collinearity.2 Rate ratios by birth group for the original rates of reported cases of HCV infection, their 95% confidence intervals (95% CI) and regression coefficients were calculated using STATA 11 (Stata Corp LP).
Results
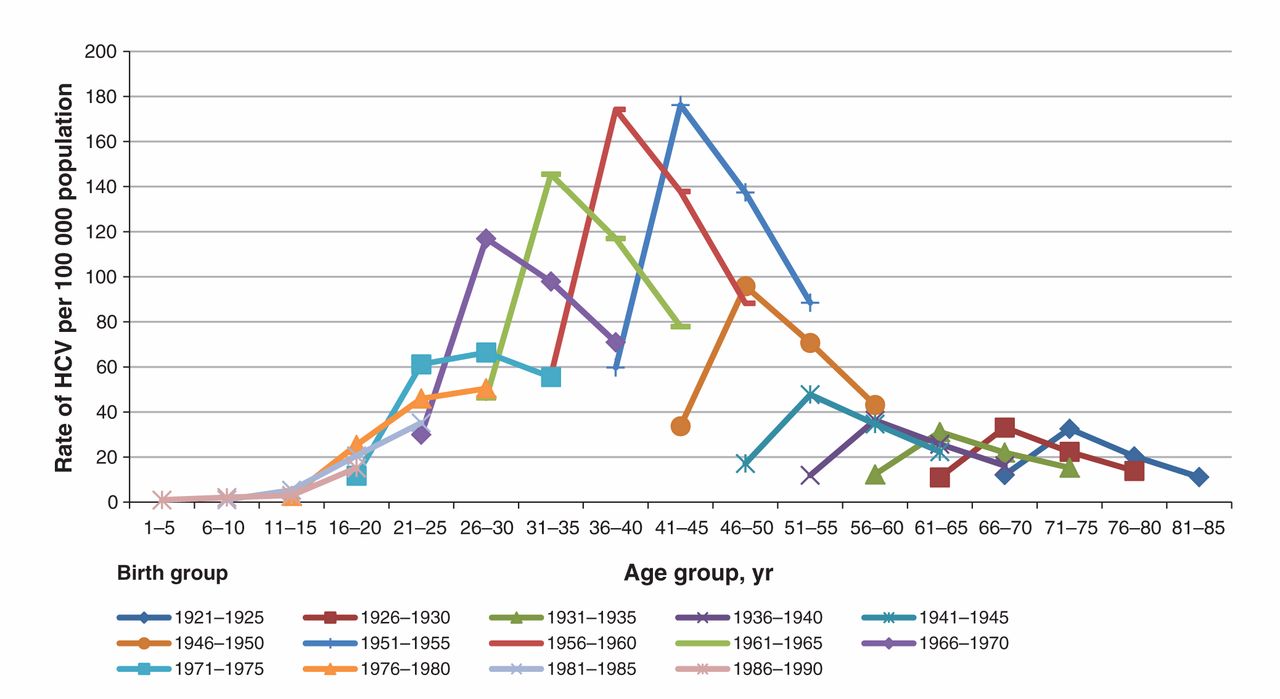
Figures 1 and 2 show the reported HCV rates standardized per 100 000 population in males and females for the period from 1991 to 2010, stratified by birth group, age group and reporting period. Although the HCV rates in males were on average twice as high as the rates in females for all birth groups, the distribution of HCV infection rates by both birth group and reporting period was strikingly similar: rates were the highest among those born between 1951 and 1970 in both males and females in all 4 reporting periods.

Reported rates of hepatitis C virus (HCV) in Canadian males over four reporting periods between 1991 and 2010 by age and birth groups (Canadian Notifiable Diseases Surveillance System, 2012).

Reported rates of hepatitis C virus (HCV) in Canadian females over four reporting periods between 1991 and 2010 by age and birth groups (Canadian Notifiable Diseases Surveillance System, 2012).
Table 2 describes the relative contribution of each of 3 birth groups (1921–1945, 1946–1965 and 1966–1990) to the pool of reported cases of HCV infection, with those born between 1946 and 1965 having contributed more than half of all reported cases of HCV infection between 1991 and 2010. Over 4 reporting periods, reported rates were decreasing in those born in 1921–1965, but increasing in those born after 1965.
After performing the mean polish procedure on the log-logit-transformed HCV infection rates, a systematic deviation from 0, indicative of the cohort effect, was observed in both males and females (data not shown).
Table 3 shows the ratios of the reported rates of HCV infection in the 5-year birth groups to the rates in the reference birth group (born between 1941 and 1945) in both males and females. Males and females born between 1946 and 1965 had 21%−40% and 12%−43% higher rates of reported cases of HCV infection, respectively, in comparison with the reference birth group.
After fitting a fixed-effects panel regression model, in both males and females, the overall models and the “cohort effect” variable were significant, with more than half of the variance explained by the latter (Table 4).
Interpretation
Main findings
Rate ratios, the direction and the magnitude of the associations between “birth group” variable and the reported rates of HCV were similar in male and female subsets of the data. Our analysis suggests a large pool of reported cases of HCV infection in those born between 1946 and 1970. Over the 4 reporting periods (1991–1995, 1996–2000, 2001–2005 and 2006–2010), the birth cohort 1946 and 1965 was the highest contributor to the reported rates of HCV infection in Canada (Table 2). Significantly higher rates of reported HCV infection than theses in the respective sexes of the reference birth group (1941−1945) were also observed in those born after 1965: in males born up to 1970 and in females born up to 1975 (Table 3).
Comparison with other studies
The scope of our findings is generally in line with the cohort effect previously described in first-time blood donors15 and hospital patients23 in Canada. The possible explanations for the observed findings include past exposure to injection drug use, blood transfusions before the introduction of universal HCV screening, other invasive procedures in health care settings, tattooing and high-risk sexual exposure among people with compromised immune systems and people co-infected with sexually transmitted infections.
History of injection drug use has been found to be the leading risk factor for HCV acquisition in studies of HCV risk factors in first-time blood donors24 and other populations25 in Canada. It was suggested that the majority of injecting drug users become infected with HCV during the first year of injecting.26 High reported measures of injecting among baby boomers in Canada are evident in the findings of the 2004 Canadian Addictions Survey,27 which reported the highest lifetime prevalence of injection drug use in those 45–54 years of age, i.e., those born between 1950 and 1959. An observed reduction in the use of injectable opioids in Canada, estimated by some at almost 25%,28 may be one of the reasons for the observed reduction in reported HCV infections in the last 2 reporting periods studied (2001–2005 and 2006–2010), although recent evidence suggests that such a change might have been temporary.29
Canadian public health has documented examples of iatrogenic transmission of HCV to the Canadian populations. At least 30 000 HCV infections in Canada resulted from blood and blood products transfusions that took place between 1986 and 1990, as discovered during the inquiry conducted by the Justice Krever Commission.30 Blood transfusion has been implicated as a major risk factor for HCV infection acquisition in the look-back studies involving first-time donors in Canada.15 Because there is no evidence of sufficient precautionary measures for the prevention of transmission of HCV infection in the Canadian blood supply system before 1986 and worldwide reports of hepatocellular carcinoma found in patients whose only risk factor was transfusion-related hepatitis,31,32 it is possible that the beginning of the risk period related to blood transfusion occurred before 1986.
Evidence of iatrogenic exposures to blood-borne pathogens in health care settings is well-documented.33–35 In Canada, reuse of syringes in the administration of BCG vaccinations36 and for sedation37 has been common in some populations. Modelling exercises estimated the risk of HCV transmission associated with syringe reuse in Canada in the range of 0.5–6.3 per 1 000 000 person-procedures, with the probability for this practice to occur at a setting in the range of 2%−80%.38,39
Although tattooing is not a universally acceptable practice and is more prevalent in specific populations, such as youth, prisoners, armed forces40,41 and law-enforcement personnel,42 the practice carries a considerable risk of HCV infection. A systematic review and meta-analysis of tattooing and risk of HCV transmission reported a pooled odds ratio (OR) of 2.74 (95% confidence interval [CI] 2.38–3.15) across all studies in all persons and an OR of 5.74 (95% CI 1.98–16.66) in those who did not report use of injectable drugs.43 Ten to 16% of youth (12−18 years old) and 3%−10% of the general population reported having permanent tattoos,44 and an estimated 50 000 new tattoos are being done every year in the US.45 In Canada, 10%−12% of Enhanced Street Youth Surveillance respondents reported having a tattoo (Surveillance and Epidemiology Division, Centre for Communicable Diseases and Infection Control, Public Health Agency of Canada, unpublished data, 2012). Although it has a low probability of transmission, sexual transmission of HCV infection has been documented in people who have multiple sexual partners46 and who are co-infected with sexually transmitted infections.47,48
Limitations
Our findings are representative of 6 jurisdictions that reported line-listed data throughout the reporting period, accounting for about 88% of the Canadian population. The remaining 7 jurisdictions contributed < 6% of the total cases of HCV infection reported to the Canadian Notifiable Diseases Surveillance System between 1991 and 2010; for this reason and because of the similarity in age and sex composition of the jurisdictions included and excluded from the analysis, the overall effect of this exclusion on the final results is expected to be minimal.
Both the national surveillance case definition of HCV infection and the protocols used by individual jurisdictions for defining and reporting cases of HCV infection (within the framework of the national surveillance) have evolved in Canada since 1991. Two revisions to the case definition of HCV infection have been made (in 19996 and 200820); however, acute and chronic infections have not been distinguished in the reports submitted to the Canadian Notifiable Diseases Surveillance System, and it has been maintained that confirmatory testing for a case of HCV infection can be done by a second manufacturer’s enzyme immunoassay, immunoblot or polymerase chain reaction (PCR) test for HCV. The provision allowing to utilize other manufacturer enzyme immunoassays for confirmatory purposes and the lower sensitivity and specificity of the first- and second-generation assays for HCV49,50 has likely resulted in a currently unknown number of false-positive test results reported as confirmed cases of HCV infection in Canada.
The observed increase in the HCV case reports in the period of 1996–2000 (represented by the second data point in the 4-point curves shown in Figures 1 and 2) is likely due to a change in and scale-up of testing for HCV infection and reporting practices, and requires further examination. Also, it is possible that some of the reduction in the newly reported HCV cases in Canadian jurisdictions (third and fourth points on the curves in Figures 1 and 2) can be attributed to a reduction in the number of false-positive results due to a gradual increase in the utilization of more specific confirmatory assays, such as immunoblot and PCR, by Canadian jurisdictions (Surveillance and Epidemiology Division, Centre for Communicable Diseases and Infection Control, Public Health Agency of Canada, unpublished data, 2013). Also, about one-quarter of acute HCV infections have the ability to clear spontaneously51 with higher clearance rates in younger individuals,52 females and Aboriginal persons;53 therefore, it is possible that rates of HCV infection in these population groups might have been overestimated.
Overall, the reported rates of HCV infections are likely to underestimate the number of HCV infections in Canada in light of the low awareness of HCV status found in a national household survey19 and the slow and asymptomatic clinical course of most HCV infections.54
Overlapping adjacent birth cohorts and the choice of age categories (5 yr) might have affected the precision of our estimates because of the averaging effect. In an effort to test the sensitivity of our findings, a 15% increase or decrease in case reports (data not shown) did not produce results that were significantly different from values already reported.
Although the mean polish analysis used in our study has been shown to be reliable, robust and relatively simple in identifying and measuring the cohort effect as an interaction of age group by period in comparison with other methods,55 our findings should be interpreted with caution and require more evidence from both national and special population surveys. As an interim approach, sensitivity analyses, mathematical modelling or estimation and triangulation techniques are warranted to produce and validate age-specific estimates of the HCV burden in various populations of Canadians.
Conclusion
Our analysis adds to what is already known about the HCV cohort effect in Canadian baby boomers15,23 by using nationally representative case report data for HCV infection and will support public health efforts to address the needs of the populations affected by HCV.
Supplemental information
For reviewer comments and the original submission of this manuscript, please see www.cmajopen.ca/content/2/4/E281/suppl/DC1
Acknowledgements
The authors thank the following individuals for their support in the preparation of this analysis: Stephanie Totten, Dena Schanzer, Hong-Xing Wu, Tom Wong, Pushpa Narayanan and Cindy Hyson (Public Health Agency of Canada); Gilles Delage (Héma Québec); two anonymous reviewers; and staff of the provincial and territorial Ministries of Health involved in the national reporting of HCV infection and staff of the sites of the former Enhanced Hepatitis C Strain Surveillance System. The authors of this paper have not named the jurisdictions that reported line-listed data throughout the reporting period because established collaboration practices preclude them from doing so. The authors decided to publish this paper without this information, as we felt that it was more important to communicate their findings than to insist on transparency.
Footnotes
-
Competing interests: None declared.
-
Contributors: Max Trubnikov and Ping Yan conceived and designed the study. Jane Njihia acquired the data. Max Tubnikov, Ping Yan and Chris Archibald analyzed and interpreted the data. Max Trubnikov drafted the article. All of the authors revised the manuscript, approved the final version submitted for publication and agreed to act as guarantors of the work.
References
- © 2014 Canadian Medical Association or its licensors
In this issue

Article tools


