


Article Figures & Tables
Figures
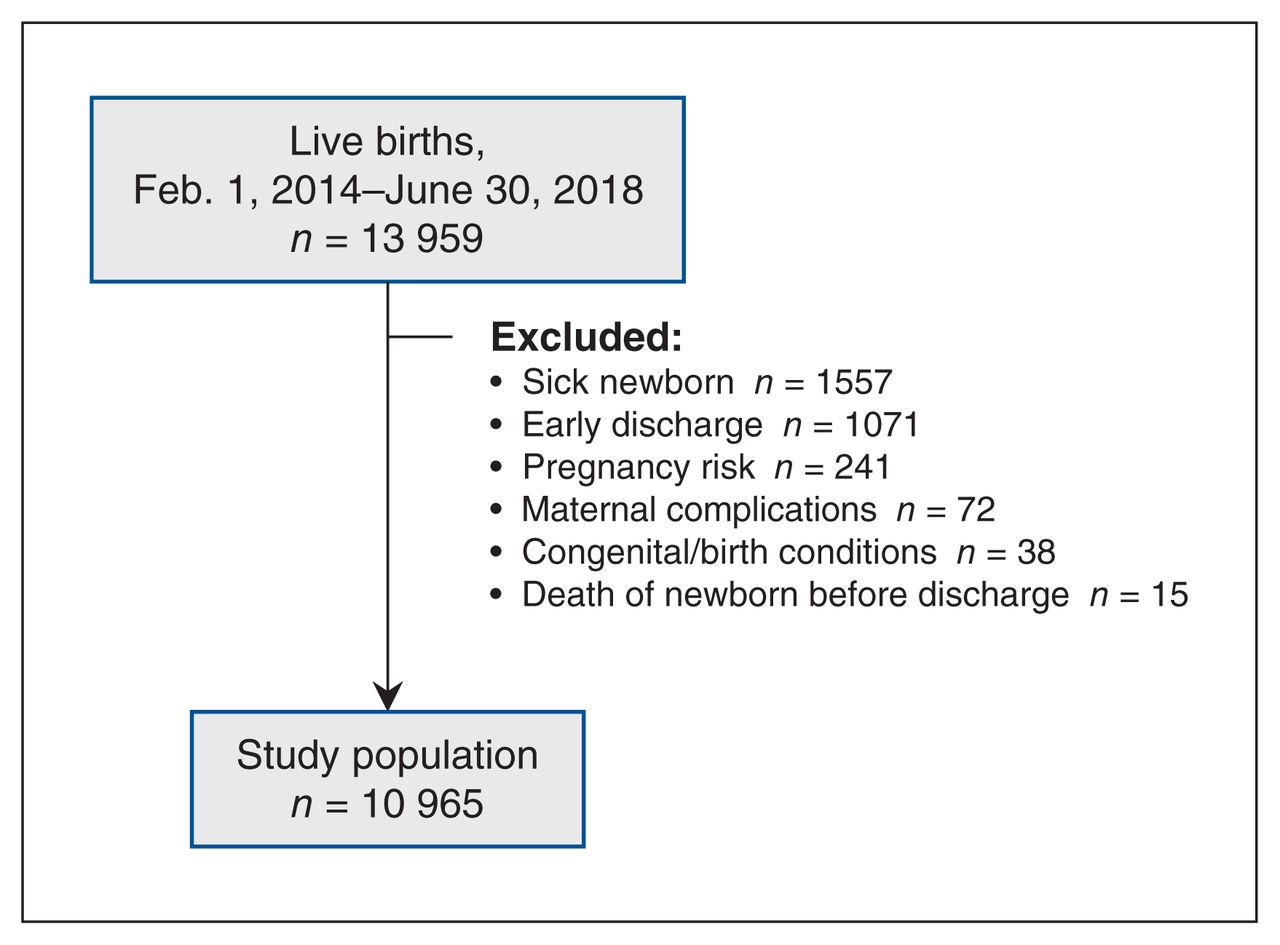
- Figure 1:
Study inclusion flow diagram. Exclusion criteria were as follows: sick newborn = a newborn with an illness (e.g., transient tachypnea of the newborn requiring admission to intensive care); early discharge = discharge before 24 hours of life; pregnancy risk = a pregnancy-related condition (e.g., twin pregnancy, birth at gestational age < 35 wk); maternal complications = maternal obstetrical complications or treatment (e.g., sepsis or admission to intensive care); congenital/birth condition = newborn congenital malformations (e.g., cleft palate), global conditions (e.g., Down syndrome) or birth complications (e.g., long-bone fracture).

Tables
- Table 1:
Glucose measurements recorded per newborn for all babies and by screening indication
No. of glucose measurements Screening indication; no. (%) of newborns All newborns
n = 10 965Large for GA
n = 1253Small for GA
n = 151Premature
n = 159Birthing parent with diabetes
n = 5600 8124 (74.1) 432 (34.5) 11 (7.3) 9 (5.7) 30 (5.4) 1 580 (5.3) 117 (9.3) 6 (4.0) 8 (5.0) 49 (8.8) 2 309 (2.8) 130 (10.4) 3 (2.0) 7 (4.4) 52 (9.3) 3 363 (3.3) 162 (12.9) 7 (4.6) 12 (7.5) 86 (15.4) ≥ 4 1589 (14.5) 412 (32.9) 124 (82.1) 123 (77.4) 343 (61.3) Note: GA = gestational age.
Characteristic No. (%)† All newborns
n = 10 965Screened
n = 1952Unscreened
n = 9013GA, wk, mean ± SD 39.3 ± 1.2 39.0 ± 1.4 39.4 ± 1.1 Birth weight, g, mean ± SD n = 10 855
3458 ± 453n = 1936
3411 ± 721n = 8919
3468 ± 369Apgar score, mean ± SD n = 10 122
8.39 ± 0.90n = 1815
8.32 ± 0.99n = 8307
8.41 ± 0.88Birthing parent with diabetes 560 (5.1) 429 (22.0) 131 (1.5) Premature 159 (1.5) 135 (6.9) 20 (0.2) Weight for GA n = 10 860 n = 1936 n = 8924 Normal 9456 (87.1) 1231 (63.6) 8225 (92.2) Large 1253 (11.5) 574 (29.6) 679 (7.6) Small 151 (1.4) 131 (6.8) 20 (0.2) Exclusively breastfed at 24 h n = 10 096
4325 (42.8)n = 1772
543 (30.6)n = 8324
3782 (45.4)Birth year 2014 2527 (23.0) 342 (17.5) 2185 (24.2) 2015 2610 (23.8) 385 (19.7) 2225 (24.7) 2016 2353 (21.5) 475 (24.3) 1878 (20.8) 2017 2314 (21.1) 497 (25.5) 1817 (20.2) 2018 1161 (10.6) 253 (13.0) 908 (10.1) Antenatal parity ≥ 1 5821 (53.1) 996 (51.0) 4825 (53.5) Hypertension or pre-eclampsia 684 (6.2) 181 (9.3) 503 (5.6) Obesity 1431 (13.1) 365 (18.7) 1066 (11.8) Smoking by the birthing parent 766 (7.0) 145 (7.4) 621 (6.9) Social issues or perinatal inpatient drug screening 167 (1.5) 42 (2.2) 125 (1.4) Marital status divorced, single or widowed (v. married or common law) 818 (7.5) 148 (7.6) 670 (7.4) Pyrexia 219 (2.0) 30 (1.5) 189 (2.1) Induced 2984 (27.2) 705 (36.1) 2279 (25.3) Mode of birth Simple vaginal 7262 (66.2) 1232 (63.1) 6023 (66.8) Assisted vaginal 971 (8.9) 190 (9.7) 781 (8.7) Elective cesarian 1341 (12.2) 234 (12.0) 1107 (12.3) Emergency cesarian 1391 (12.7) 291 (14.9) 1100 (12.2) 5-minute Apgar score ≤ 7 176 (1.6) 34 (1.7) 142 (1.6) ≥ 8 10 578 (96.5) 1878 (96.2) 8700 (96.5) Brief postnatal CPAP 392 (3.6) 100 (5.1) 292 (3.2) Newborn cardiorespiratory issue 394 (3.6) 96 (5) (4.9) 298 (3.3) Laceration None 4483 (40.9) 827 (42.4) 3656 (40.6) First or second degree 6064 (55.3) 1047 (53.6) 5017 (55.7) Third or fourth degree 418 (3.8) 78 (4.0) 340 (3.8) Postpartum hemorrhage or anemia 952 (8.7) 184 (9.4) 768 (8.5) Birthing parent obstetric complication 5592 (51.0) 997 (51.1) 4595 (51.0) Note: CPAP = continuous positive airway pressure, GA = gestational age.
↵* As per the study protocol, preterm babies born earlier than 36 weeks were excluded from the study since they were observed and cared for in the special care nursery following birth. Appendix 1 (available at www.cmajopen.ca/content/11/2/E381/suppl/DC1) offers more information on variable definitions and source data.
↵† Unless stated otherwise.
Feeding method No. (%) of newborns Screened
n = 1772Unscreened
n = 8324At the breast only 506 (28.6) 3560 (42.8) Expressed breastmilk and the breast 37 (2.1) 222 (2.7) Breastmilk and formula 1144 (64.6) 4147 (49.8) Formula only 85 (4.8) 395 (4.7) ↵* p value for difference < 0.001.
Variable OR (95% CI) Screened (≥ 3 measures v. < 3 measures) 0.57 (0.51–0.64) Birth year 2014 Ref. 2015 0.92 (0.82–1.04) 2016 0.70 (0.62–0.79) 2017 0.71 (0.63–0.80) 2018 0.92 (0.75–1.12) Antenatal parity ≥ 1 1.88 (1.71–2.06) Hypertension or pre-eclampsia 0.87 (0.72–1.05) Obesity 0.83 (0.72–0.95) Smoking by the birthing parent 0.76 (0.64–0.91) Social issues or perinatal inpatient drug screening 0.57 (0.38–0.85) Marital status divorced, single or widowed (v. married or common law) 0.65 (0.55–0.78) Pyrexia 0.73 (0.53–1.00) Induced 0.83 (0.75–0.91) Mode of birth Simple vaginal Ref. Assisted vaginal 0.86 (0.73–1.01) Elective cesarian 0.80 (0.68–0.94) Emergency cesarian 0.80 (0.67–0.95) 5-minute Apgar score ≥ 8 1.48 (0.99–2.22) Brief postnatal CPAP 1.13 (0.79–1.62) Newborn cardiorespiratory issue 0.94 (0.67–1.32) Laceration None Ref. First or second degree 0.95 (0.84–1.07) Third or fourth degree 0.92 (0.72–1.18) Postpartum hemorrhage or anemia 0.98 (0.84–1.13) Birthing parent obstetric complication 0.91 (0.84–0.99) Note: CI = confidence interval, CPAP = continuous positive airway pressure, OR = odds ratio, Ref. = reference category.
↵* The final step of the model is presented; 1256 newborns were omitted owing to missing data. The first model of the binary hierarchical logistic regression contained the confounder variables, and was significant over the null hypothesis, χ2(22) = 501 p < 0.001, with an Nagelkerke R square = 0.068. The second model added glucose screening (≥ 3 v. < 3 measures) on exclusive breastfeeding at 24 hours. The logistic regression was significant over null hypothesis (χ2(23) = 595; p < 0.001), and an improvement over the first model (χ2(1) = 94; p < 0.001) with an R square = 0.080.
- Table 5:
Multipredictor model of exclusive breastfeeding, screening status divided by indication (n = 8297)*
Variable OR (95% CI) < 3 glucose measures, screen not indicated Ref. Screened (≥ 3 measures), preterm 0.23 (0.14–0.38) Screened (≥ 3 measures), small for GA 0.25 (0.14–0.44) Screened (≥ 3 measures), birthing parent with diabetes 0.57 (0.44–0.73) Screened (≥ 3 measures), large for GA 0.72 (0.59–0.87) Birth year 2014 Ref. 2015 0.89 (0.78–1.01) 2016 0.66 (0.58–0.76) 2017 0.71 (0.62–0.81) 2018 0.90 (0.72–1.11) Antenatal parity ≥ 1 1.82 (1.64–2.01) Hypertension or pre-eclampsia 0.85 (0.70–1.04) Obesity 0.77 (0.67–0.90) Smoking by the birthing parent 0.80 (0.66–0.96) Social issues or perinatal inpatient drug screening 0.61 (0.40–0.94) Marital status divorced, single or widowed (v. married or common law) 0.66 (0.55–0.80) Pyrexia 0.70 (0.50–1.00) Induced 0.85 (0.77–0.95) Mode of birth Simple vaginal Ref. Assisted vaginal 0.91 (0.76–1.08) Elective cesarian 0.79 (0.66–0.93) Emergency cesarian 0.80 (0.67–0.97) 5-minute Apgar score ≥ 8 1.55 (1.01–2.38) Brief postnatal CPAP 1.32 (0.89–1.96) Newborn cardiorespiratory issue 0.87 (0.59–1.26) Laceration None Ref. First or second degree 0.92 (0.80–1.04) Third or fourth degree 0.81 (0.62–1.05) Postpartum hemorrhage or anemia 0.96 (0.82–1.13) Birthing parent obstetric complication 0.90 (0.82–0.99) Note: CI = confidence interval, CPAP = continuous positive airway pressure, GA = gestational age, OR = odds ratio, Ref. = reference category.
↵* The final step of the model is presented; 2668 newborns were omitted owing to missing data. The logistic regression was significant over null hypothesis (χ2(26) = 499; p < 0.001), and a small improvement over the first model (Table 3) (χ2(4) = 96; p < 0.001) with an Nagelkerke R square = 0.078.
- Table 6:
Multipredictor model of exclusive breastfeeding, including screen status and screen indications (n = 9709)*
Variable OR (95% CI) Screened (≥ 3 measures v. < 3 measures) 0.64 (0.56–0.73) Screening indication None Ref. Preterm 0.37 (0.23–0.58) Small for GA 0.37 (0.22–0.63) Birthing parent with diabetes 0.88 (0.69–1.10) Large for GA 1.03 (0.89–1.19) Birth year 2014 Ref. 2015 0.92 (0.82–1.04) 2016 0.70 (0.61–0.79) 2017 0.71 (0.62–0.81) 2018 0.92 (0.75–1.12) Antenatal parity ≥ 1 1.86 (1.70–2.04) Hypertension or pre-eclampsia 0.89 (0.74–1.07) Obesity 0.82 (0.71–0.94) Smoking by the birthing parent 0.77 (0.64–0.92) Social issues or perinatal inpatient drug screening 0.57 (0.38–0.85) Marital status divorced, single or widowed (v. married or common law) 0.65 (0.55–0.77) Pyrexia 0.72 (0.52–0.99) Induced 0.84 (0.76–0.93) Mode of birth Simple vaginal Ref. Assisted vaginal 0.85 (0.73–1.01) Elective cesarian 0.80 (0.68–0.94) Emergency cesarian 0.79 (0.67–0.94) 5-minute Apgar score ≥ 8 1.50 (1.00–2.24) Brief postnatal CPAP 1.13 (0.79–1.61) Newborn cardiorespiratory issue 0.93 (0.66–1.31) Laceration None Ref. First or second degree 0.94 (0.83–1.06) Third or fourth degree 0.90 (0.70–1.15) Postpartum hemorrhage or anemia 0.98 (0.84–1.13) Birthing parent obstetric complication 0.91 (0.83–0.99) Note: CI = confidence interval, CPAP = continuous positive airway pressure, GA = gestational age, OR = odds ratio, Ref. = reference category.
↵* The final step of the model is presented;1256 newborns were omitted owing to missing data. The tertiary binary logistic regression was also significant over null hypothesis (χ2(27) = 614; p < 0.001), and a small improvement over the second model (screening risk factors) (χ2(1) = 43; p < 0.001) with an Nagelkerke R square = 0.085.
In this issue

Article tools


