


Abstract
Background: With an aging population in Ontario, ophthalmologists provide most of their care to older adults, which has prominent human resource implications. In this study, we sought to investigate the supply and demographic characteristics of Ontario’s ophthalmologists.
Methods: In this retrospective, population-based analysis, we evaluated cohort demographics, including sex and career stage, of Ontario’s ophthalmologists from 2010 to 2019, which we reported using descriptive statistics. Similarly, we detailed ophthalmologist supply within different areas of care using descriptive statistics.
Results: Over the study period, a median of 464 ophthalmologists were practising in Ontario each year. The proportion of female ophthalmologists increased from 18.7% in 2010 to 24.1% in 2019. The proportion of late-career ophthalmologists (aged > 55 yr) significantly increased by 6.4% over the study period and constituted 45.3% of the workforce in 2019. Comprehensive cataract surgery was the most common area of care. Although the number of ophthalmologists per 100 000 people remained stable over the study period (3.27 ophthalmologists/100 000 people in 2019), the number of ophthalmologists per 100 000 people aged 65 years and older fell by 18.4% from 2010 to 2019. The greatest supply reduction was among moderate-volume comprehensive cataract surgeons (−20.2% overall and −35.4% relative to the population aged ≥ 65 yr).
Interpretation: Between 2010 and 2019, the overall number of ophthalmologists in Ontario remained stable; however, we observed declines in the number of ophthalmologists per 100 000 people aged 65 years and older for most areas of care. Nearly half of the ophthalmology workforce is now older than 55 years and female representation is increasing.
Ophthalmologists provide 62% of their care to older adults.1 Ontario’s population is aging, and projections indicate that people older than 65 years will account for 25% of the population by 2041.2 This has prominent human resource implications given that the use of ophthalmic services is higher among older individuals, who commonly present with age-related conditions.3–6 Technological advances have led to diagnostic and treatment advances, which have improved efficiency in the field. To understand how these factors have affected the sustainability of eye care delivery, human resource analyses have assessed the adequacy of the current and future supply of ophthalmologists that will serve the Canadian population.7–11 One of these studies reported 4.91 times more optometrists than ophthalmologists in Ontario in 2012.11
Some of these studies were cross-sectional and relied on data from the Canadian Medical Association, which may be outdated, given that the most recent data were collected in 2012.10,11 These data sets may include inactive ophthalmologists and are based on self-reported fellowship training. We identified a need to use real-time physician billing data, assess longitudinal trends and explore supply using practice patterns as opposed to fellowship training. Although some longitudinal studies have explored workforce trends in focused areas of care,12–17 we recognized a need for an updated and comprehensive analysis assessing all areas of care in ophthalmology. As such, we sought to evaluate the supply and demographic characteristics of Ontario’s ophthalmologists in comprehensive and noncomprehensive areas of care from 2010 to 2019 using provincial billing data.
Methods
Study design, setting and data sources
Ontario provides publicly funded health care to its citizens through the Ontario Health Insurance Plan (OHIP). Given that OHIP is the sole payer of medically necessary, physician-delivered health care services, billing data have been validated as an accurate source to capture details on actively practising physicians.18–22 Notably, some services are not covered by OHIP, such as routine eye examinations by optometrists for patients aged 20–64 years and some elective surgeries (e.g., refractive surgery) within ophthalmology.
We obtained population-level health care data from the Ontario Ministry of Health and Long-Term Care (MOHLTC) under an agreement with the Ontario Medical Association (OMA). We conducted a population-based analysis of Ontario data from Apr. 1, 2010, to Mar. 31, 2020 (fiscal years 2010–2019, inclusive). This 10-year period allowed us to evaluate trends while avoiding changes to billing and scope of practice that resulted from the COVID-19 pandemic. To characterize Ontario’s ophthalmology workforce, variables included supply, sex and age of ophthalmologists in each fiscal year, both overall and in specific areas of care. We extracted data from MOHLTC datafiles, which consisted of validated provincial billing data shared with the OMA. The identity of all physicians and patients was protected in reporting data. We obtained Ontario’s population estimates for the study period from Statistics Canada.23
Study population and data collection
To capture actively practising ophthalmologists, we included all physicians who use the unique OHIP specialty code for ophthalmology and who submitted at least 100 billing claims per fiscal year. We then classified physicians into specific areas of care using the classification criteria in Table 1. Coding details are outlined in Appendix 1, Supplementary Table 1, available at www.cmajopen.ca/content/10/4/E1067/suppl/DC1. We note a distinction between areas of care and subspecialty; we used billing information rather than fellowship training to characterize an ophthalmologist’s scope of practice, given that daily clinical services may differ considerably from the specialization of training. Billing data have been used previously to evaluate the supply of ophthalmologists in various areas of care over time; criteria used in these studies are also referenced in Table 1.12–17 Ophthalmologists from each area of care reviewed definitions, and we adjusted them based on expert feedback.1–3 For this study, comprehensive areas of care included general medical ophthalmology and comprehensive cataract surgery; noncomprehensive areas of care referred to all other medical and surgical areas of care. Comprehensive cataract surgeons included those who provided low, moderate and high volumes of cataract surgery; noncomprehensive surgeons included corneal surgeons, glaucoma surgeons, retinal surgeons and oculoplastic surgeons.
Classification criteria for the inclusion of ophthalmologists to an area of care
We also extracted sex and age data for each fiscal year. As guided by previous studies, we considered ophthalmologists younger than 45 years to be early-career physicians, those aged 45–55 years to be middle-career physicians and those older than 55 years to be late-career physicians.9,10,14 We further divided late-career ophthalmologists into 4 cohorts (56–60 yr, 61–65 yr, 66–70 yr and ≥ 70 yr).
Statistical analysis
To explore representation by sex, we investigated the proportion of female ophthalmologists in the overall sample and across areas of care. To characterize the age of ophthalmologists, we determined the proportion of early-, middle- and late-career ophthalmologists in the overall sample and in various areas of care. The supply of ophthalmologists in previous studies was standardized to the population. 10,11 We therefore calculated the number of ophthalmologists per 100 000 Ontario residents within each area of care. We also calculated the number of ophthalmologists per 100 000 Ontario residents aged 65 years and older within each area of care. We calculated the absolute or relative percentage change over the 10-year period for each analysis. We used Microsoft Excel to compute and graphically represent all descriptive statistics. We assessed significant changes in time trends in career stage from 2010 to 2019 using the Mann–Kendall trend test.
Ethics approval
The study’s protocol was approved by University of Toronto’s Research Ethics Board (Protocol ID: 00040078), in Toronto, Canada.
Results
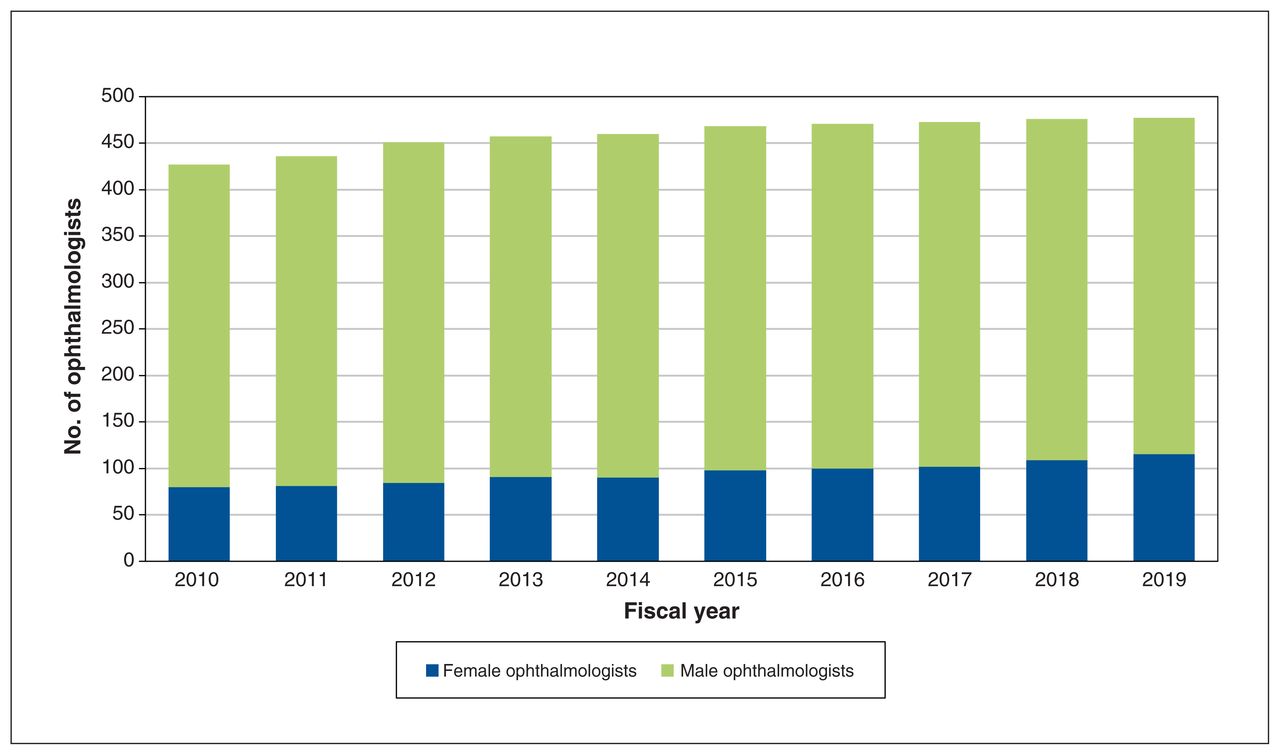
Across the study period, a yearly median of 464 (interquartile range [IQR] 447–477) ophthalmologists actively practised in Ontario (Table 2, Figure 1). Although the overall number of ophthalmologists per 100 000 people remained stable (3.25 ophthalmologists/100 000 people in 2010, 3.27 ophthalmologists/100 000 people in 2019; relative percentage change +0.7%), the number of ophthalmologists per 100 000 people aged 65 years and older declined substantially (23.30 ophthalmologists/100 000 people 65 yr and older in 2010, 19.00 ophthalmologists/100 000 people 65 yr and older in 2010; relative percentage change −18.4%) across the study period.
Number of ophthalmologists and female ophthalmologists, overall and by area of care, from 2010 to 2019

Number of female and male ophthalmologists practising from 2010 to 2019 in Ontario.
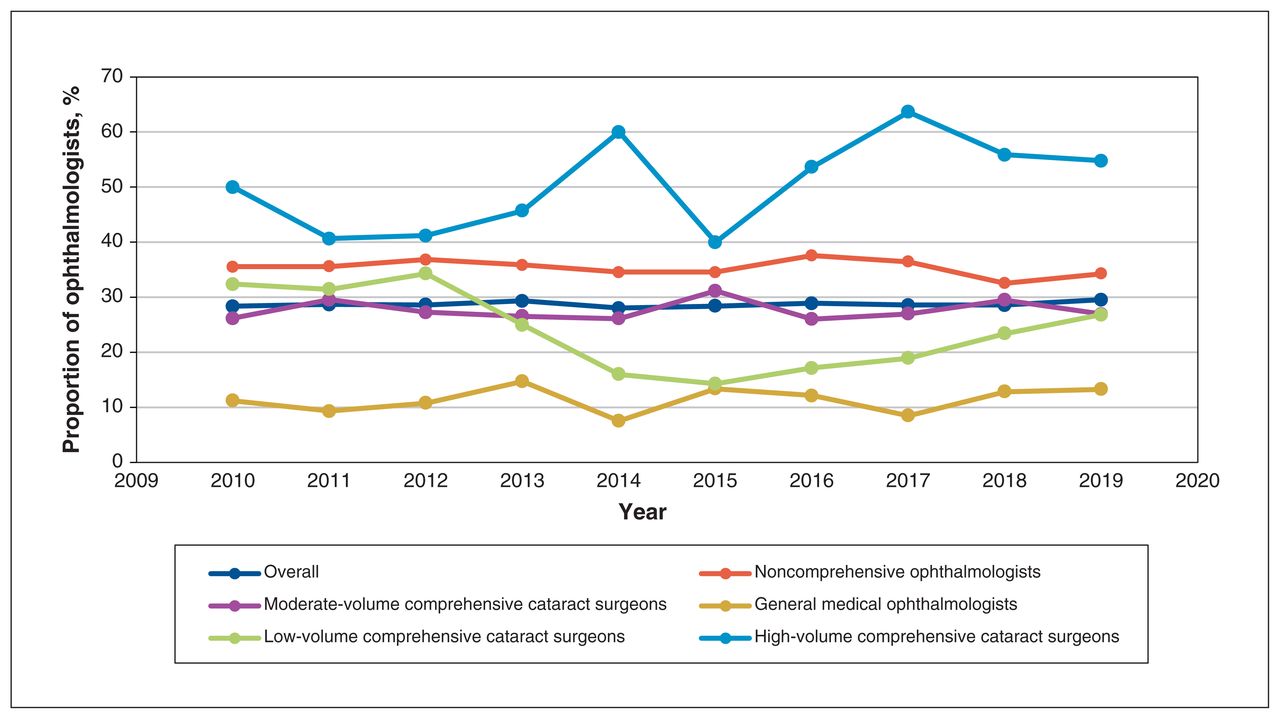
Overall, female representation increased from 18.7% to 24.1% of all ophthalmologists (Table 2, Figure 1). Noncomprehensive surgeons (15.4% in 2019) included a lower percentage of female ophthalmologists than low-volume (35.7% in 2019) and moderate-volume comprehensive cataract surgeons (26.1% in 2019), but had a comparable proportion to high-volume comprehensive cataract surgeons (14.6% in 2019) (Figure 2). We observed increases in the absolute percentage of females among moderate-volume comprehensive cataract (+11.5%), high-volume comprehensive cataract (+5.8%) and noncomprehensive surgeons (+4.7%), but the percentage among low-volume comprehensive cataract surgeons (−1.8%) remained stable (Table 3). The areas of care with the lowest and greatest proportion of female ophthalmologists were retina surgeons (7.5% in 2019) and pediatric ophthalmologists (48.0% in 2019), respectively.

Trends in the proportion of female ophthalmologists practising in noncomprehensive surgical (i.e., corneal surgeons, glaucoma surgeons, oculoplastic surgeons and retinal surgeons), general medical and comprehensive surgical areas of care from 2010 to 2019 in Ontario. *Pediatric ophthalmology was not considered as a surgical subspecialty because nonsurgical pediatric ophthalmologists were also included in this cohort.
Proportion of female ophthalmologists, overall and in general medical, noncomprehensive surgical and comprehensive surgical areas of care, in 2010 and 2019
The overall proportion of early-career ophthalmologists stayed stable (Figure 3). Middle-career ophthalmologists decreased from 32.8% in 2010 to 26.0% in 2013, and plateaued at this level from 2014 to 2019 (Figure 4). Late-career ophthalmologists increased from 38.9% in 2010 to 44.6% in 2013, and plateaued at this level from 2014 to 2019 (Figure 5). In 2019, 12.2% of Ontario’s ophthalmologists were aged 56–60 years, 14.9% were aged 61–65 years, 8.0% were aged 66–70 years and 10.3% were older than 70 years; the proportion aged 61–65 years roughly doubled over the study period, while the other late-career cohorts remained stable. The greatest changes over time among early-career ophthalmologists were the decrease in the absolute percentage of high-volume comprehensive cataract surgeons (−5.5%) and the increase in the absolute percentage of low-volume comprehensive cataract surgeons (+4.8%), though these differences were small (Table 4). The greatest changes among middle-career ophthalmologists were the decrease in the absolute percentage of high-volume comprehensive cataract surgeons (−20.2%), the significant decline in general medical ophthalmologists (−13.1%) and the decline in ophthalmologists practising in noncomprehensive areas (−9.6%). The greatest changes among late-career ophthalmologists were the significant increases in the absolute percentage of high-volume comprehensive cataract surgeons (+25.8%), general medical ophthalmologists (+11.1%) and ophthalmologists practising in noncomprehensive areas (+9.5%).

Trends in the proportion of early-career ophthalmologists practising in noncomprehensive (i.e., neuro-ophthalmologists, corneal surgeons, glaucoma surgeons, retina medical ophthalmologists, retinal surgeons, oculoplastic surgeons, pediatric ophthalmologists and low-vision rehabilitation ophthalmologists), general medical and comprehensive surgical areas of care from 2010 to 2019 in Ontario.

Trends in the proportion of middle-career ophthalmologists practising in noncomprehensive (i.e., neuro-ophthalmologists, corneal surgeons, glaucoma surgeons, retina medical ophthalmologists, retinal surgeons, oculoplastic surgeons, pediatric ophthalmologists and low-vision rehabilitation ophthalmologists), general medical and comprehensive surgical areas of care from 2010 to 2019 in Ontario.

Trends in the proportion of late-career ophthalmologists practising in noncomprehensive (i.e., neuro-ophthalmologists, corneal surgeons, glaucoma surgeons, retina medical ophthalmologists, retinal surgeons, oculoplastic surgeons, pediatric ophthalmologists and low-vision rehabilitation ophthalmologists), general medical and comprehensive surgical areas of care from 2010 to 2019 in Ontario.
Proportion of early-, middle- and late-career ophthalmologists, overall and in noncomprehensive, general medical and comprehensive surgical areas of care in 2010 and 2019
Areas of care
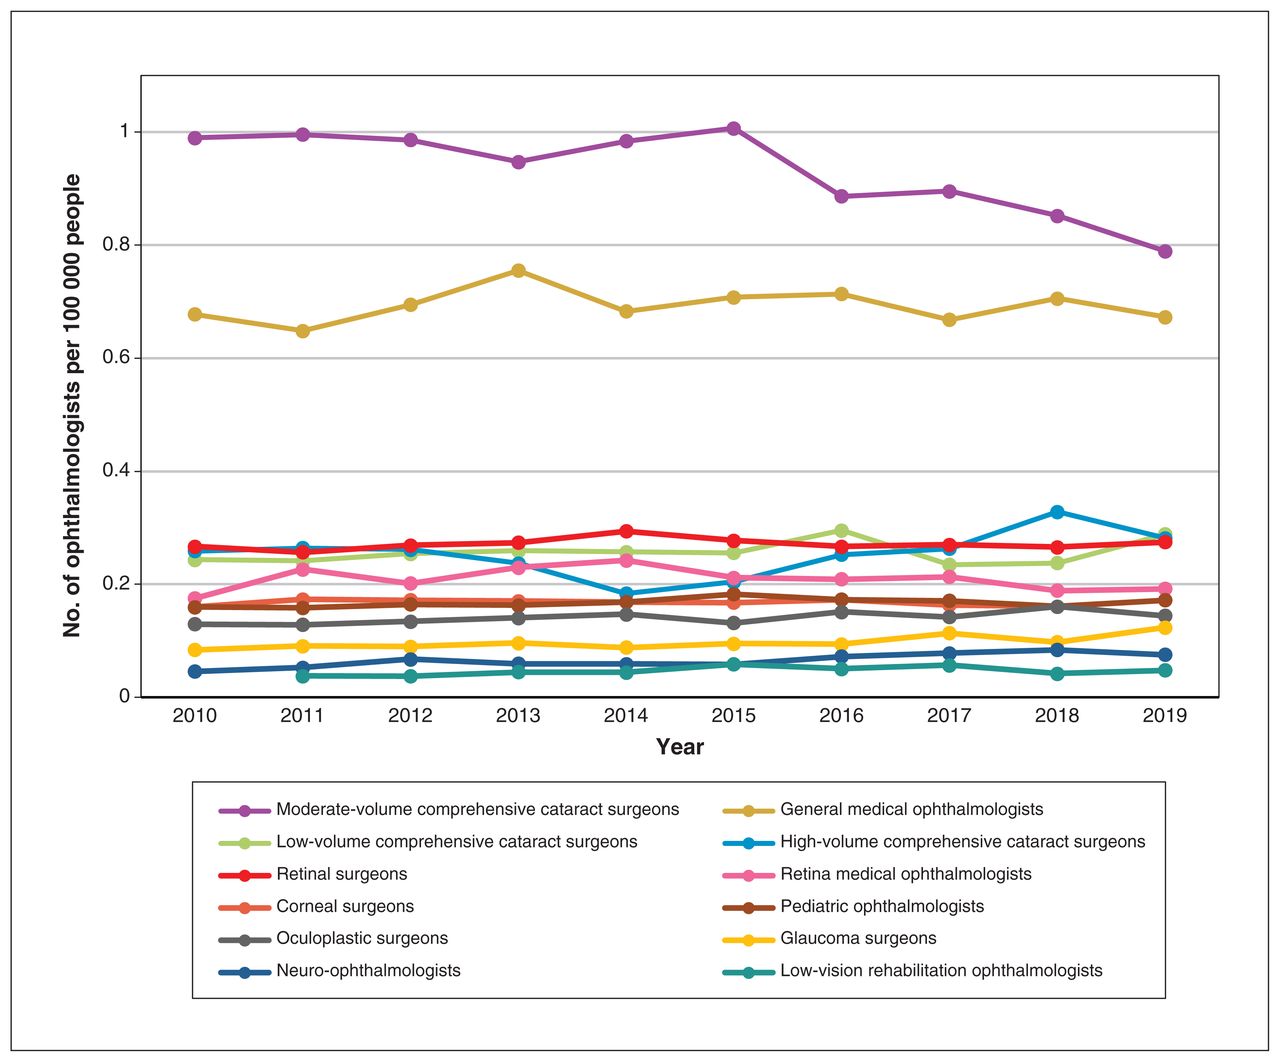
The number of ophthalmologists per 100 000 people and the changes over the study period differed among various areas of care (Figure 6, Table 5). Neuro-ophthalmologists (n = 11 in 2019, +65.3% over the study period), glaucoma surgeons (n = 18 in 2019, +47.6%) and low-vision rehabilitation ophthalmologists (n = 7 in 2019, +27.5%) had the greatest growth. Overall, the supply of comprehensive cataract surgeons decreased over time (n = 198 in 2019, −8.9%). Although there was an increase in low-(n = 42 in 2019, +18.4%) and high-volume comprehensive cataract surgeons (n = 41 in 2019, +8.7%), moderate-volume cataract surgeons (n = 115 in 2019, −20.2%) had the greatest reduction in supply of any area of care.

The number of ophthalmologists per 100 000 people practising in all areas of care from 2010 to 2019 in Ontario. The number of low-vision rehabilitation ophthalmologists for 2010 was less than 5 and cannot be reported for privacy reasons.
Number of ophthalmologists per 100 000 people (overall population and population aged 65 years and older) in 2019 fiscal year and change from 2010 to 2019 fiscal years by area of care
The number of ophthalmologists per 100 000 people aged 65 years and older and the changes over the study period also differed among various areas of care (Figure 7, Table 5). Only neuro-ophthalmologists (n = 11, +33.9%), glaucoma surgeons (n = 18, +19.5%) and low-vision rehabilitation ophthalmologists (n = 7, +5.4%) had growth. The 3 areas with the greatest reduction were moderate-volume cataract surgeons (n = 115, −35.4%), general medical ophthalmologists (n = 98 in 2019, −19.6%) and retinal surgeons (n = 40 in 2019, −16.6%).

The number of ophthalmologists per 100 000 people aged 65 years and older practising in all areas of care from 2010 to 2019 in Ontario. The number of low-vision rehabilitation ophthalmologists for 2010 was less than 5 and cannot be reported for privacy reasons. Given the nature of this analysis, pediatric ophthalmology was not analyzed.
Interpretation
The aim of this population-based analysis was to explore supply and demographic characteristics of Ontario’s ophthalmology workforce from 2010 to 2019. We observed an aging ophthalmologist workforce and growth in female representation. The overall number of ophthalmologists per 100 000 people was stable. Several areas of care increased in supply; however, most had substantial reductions in supply relative to the population aged 65 years and older, especially for comprehensive cataract surgeons.
The proportion of early-career ophthalmologists remained stable, while the proportion of middle-career ophthalmologists decreased by 7.6% and the proportion of late-career ophthalmologists increased by 6.4%. These trends are similar to a population-based analysis conducted in Ontario from 1999 to 2013.24 Furthermore, among low-volume comprehensive cataract surgeons, only the proportion of early-career physicians saw significant growth, such that this group now comprises most physicians in this area of care (54.8% in 2019). Among high-volume comprehensive cataract surgeons, there was significant growth among only late-career physicians, who make up nearly half of the physicians in this area (46.3% in 2019). We observed a similar decrease among middle-career physicians who make up about one-quarter of this category (26.8% in 2019). These findings speak to difficulties that younger graduates face in securing equitable access to operating room time relative to their colleagues later in their careers, an issue that is projected to worsen.25,26 We observed considerable growth in the percentage of late-career general medical ophthalmologists. Moreover, females continued to be underrepresented relative to males, especially in retinal surgery (7.5%), aligning with a recent national study.27 We found that the greater the surgical volume among comprehensive cataract surgeons, the less females were represented, a gender gap that was similarly highlighted in previous research.28 Female applicants to ophthalmology residency programs increased significantly from 1995 to 2019, which can explain the stable growth of female ophthalmologists witnessed in our study.29
Although the number of ophthalmologists per 100 000 people in 2019 (3.27) seems adequate, given the proposed ideal ratio of 3.37 indicated by The Royal College of Physicians and Surgeons of Canada in 1988, this suggestion was made decades ago on the assumption of a vastly different demographic mix, which did not consider the current realities of Canada’s rapidly aging population, large technological advances in therapeutics and the scope of practice of ophthalmologists and optometrists.30 Nonetheless, it is projected that there will be 14.8 ophthalmologists per 100 000 people 65 years of age and older in 2030, a further decrease of 22.1% in ophthalmologist supply relative to 2019.10 Residency program size also has human resource implications. Since the recommendation by the Ontario Vision Task Force to increase residency program size by 2–3 spots in 2013, only 1 spot has been added.25
Although neuro-ophthalmologists, glaucoma surgeons and low-vision rehabilitation ophthalmologists had the most notable increases in supply, these were also subspecialties with the smallest baseline percentage of ophthalmologists; the analysis was therefore sensitive to small changes in supply. The growth in some of these areas was also likely confounded. For example, the consult code A231 that we used to capture neuro-ophthalmologists was introduced mid-way into the 2010 fiscal year, and the observed growth in this area of care could partly be explained by the uptake of this code’s use into practice early in the study period rather than an actual increase in physicians.31 To maintain consistency in definitions, we considered only ophthalmology residency–trained neuro-ophthalmologists and not neurology residency–trained neuro-ophthalmologists. Moreover, although the supply of glaucoma surgeons remained stable from 2010 to 2016, the growth from 2017 to 2019 was likely inflated because of the increased number of general surgical ophthalmologists who performed microinvasive glaucoma surgery, which does not have its own unique billing code.32
Future research is needed to better contextualize study findings. Future studies should also explore trends in the geographic distribution of ophthalmologists in various Local Health Integrative Networks. The extent to which supply reductions have been compensated by increased clinical efficiency afforded by innovations remains unclear. In addition, optometry’s role in the delivery of Ontario’s eye services was beyond the scope of our research question, but is an important consideration when developing policy for future human resource requirements.
Limitations
A limitation of using billing data is the potential to miscategorize comprehensive ophthalmologists in noncomprehensive categories if they have a focused scope of practice in a limited number of areas of care. However, the intention of our analysis was to evaluate providers of care and not training; as a result, this limitation would not affect the interpretation. We also did not capture the nuances of group billing scenarios. Not all definitions were based in the literature; however, all underwent a thorough consultive process by experts. In addition, some definitions were not mutually exclusive and it was possible for an ophthalmologist to be included in multiple areas of care (range of 4–8 ophthalmologists were counted in multiple categories in a given fiscal year). To address these limitations, we used conservative thresholds for the minimum number of performed services to mitigate billing errors and ensure appropriate inclusion of ophthalmologists in certain areas of care. Furthermore, we classified career stage by age, which does not consider possible early and late entry of physicians into ophthalmology. The use of different age cut-offs could lead to different interpretations of data and highlights the drawback of using an ordinal variable. Unfortunately, the year of medical school graduation was not available. To avoid comparing dissimilar data, we performed an analysis until 2019 rather than including data from the COVID-19 pandemic. We recognize the historical nature of data selected and that it may not reflect the current context.
Conclusion
We observed an overall decline in the supply of comprehensive cataract surgeons. When standardized to the population of older adults, there were substantial supply reductions in most areas of care. The ophthalmology workforce is aging, which is expected to continue. Although female representation increased, gender gaps in the provision of noncomprehensive and high-volume surgical care were evident, as was the trend that early-career ophthalmologists had lower surgical volumes relative to their late-career peers. Our findings, in conjunction with data on the geographical distribution of ophthalmologists and their productivity, will help guide evidence-based policy decisions that promote the sustainability of Ontario’s eye care system.
Acknowledgements
The authors thank the Eye Physicians and Surgeons of Ontario for their written support of this project and for the Ontario Medical Association’s Department of Economics, Policy & Research for their contribution to data collection and analysis.
Footnotes
Competing interests: Marko Popovic declares institutional funding from the PSI Foundation and Fighting Blindness Canada. Matthew Schlenker reports funding from Trillium Health Partners, the Canadian Glaucoma Society and the Canadian Institutes of Health Research, as well as consulting fees and honoraria from AbbVie, Alcon, Bausch Health, Labtician, Glaucoma and Ivantis. No other competing interests were declared.
This article has been peer reviewed.
Contributors: Aman Sayal, Yusuf Ahmed, Marko Popovic, Matthew Schlenker, Robert Campbell and Sherif El-Defrawy were responsible for the conception, design and interpretation of the data. Jasmin Kantarevic, Joanna Nadolski and Karen D’Souza were responsible for the acquisition of all data. Aman Sayal was responsible for data analysis. Aman Sayal, Yusuf Ahmed and Marko Popovic were responsible for drafting the article. All of the authors revised it critically for important intellectual content, gave final approval of the version to be published and agreed to be accountable for all aspects of the work.
Data sharing: Data used in this analysis are not publicly available because of provincial privacy regulation.
Disclaimer: Population-level health care data were obtained from the Ontario Ministry of Health and Long-Term Care (MOH) under an agreement with the Ontario Medical Association (OMA). The OMA and MOHLTC had no involvement in or control over the design and conduct of the study; collection, management, analysis and interpretation of the data; preparation, review or approval of the manuscript; and decision to submit the manuscript for publication.
Supplemental information: For reviewer comments and the original submission of this manuscript, please see www.cmajopen.ca/content/10/4/E1067/suppl/DC1.
This is an Open Access article distributed in accordance with the terms of the Creative Commons Attribution (CC BY-NC-ND 4.0) licence, which permits use, distribution and reproduction in any medium, provided that the original publication is properly cited, the use is noncommercial (i.e., research or educational use), and no modifications or adaptations are made. See: https://creativecommons.org/licenses/by-nc-nd/4.0/
References
- © 2022 CMA Impact Inc. or its licensors
In this issue

Article tools


Related Articles
Cited By...
- No citing articles found.